STOCKS: Looking Long-Term
The day to day stock market jitterbug can undermine out conclusions and resolve in the short term, so it is always good to pull back and evaluate longer-term charts for a look at the big picture. At DecisionPoint our primary indicator for objectively defining a bull or bear market is the relationship of the daily 50EMA and 200EMA. When the daily 50EMA is below the 200EMA, as it has been since January 13, we consider the market to be long-term bearish. We use the daily chart (not shown) because we get faster feedback from that time frame; however, the monthly chart gives us a more stable platform to determine market condition.
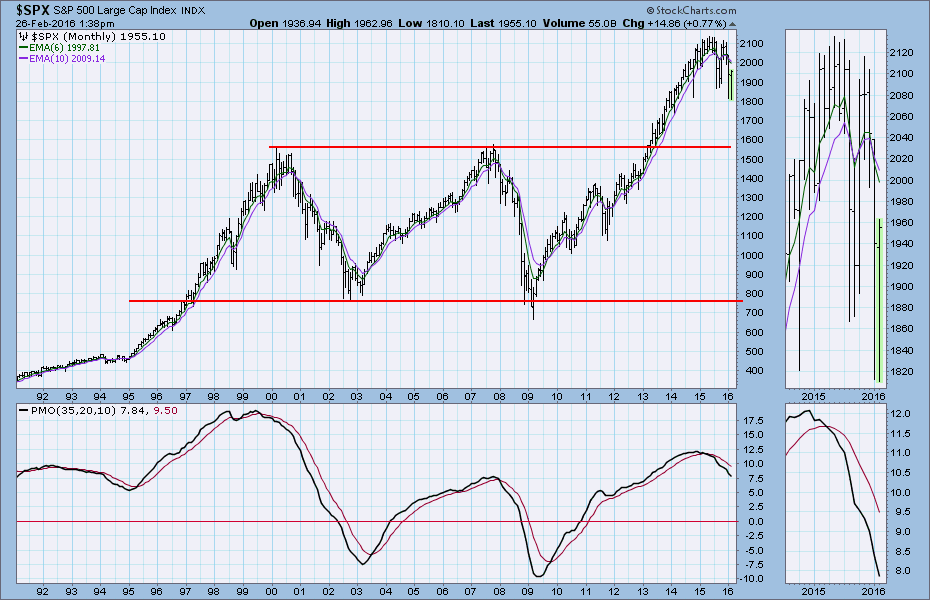
While it only becomes final at the end of the month, the monthly PMO (Price Momentum Oscillator) is a fairly reliable indicator for identifying market tops and bottoms. PMO direction changes are the first indication that price may be preparing to reverse direction, but clearly this results in a lot of false signals. A less frequent event is when the PMO crosses down through its signal line (10EMA), and this is what we use to confirm the primary indicator. We especially like to see relatively smooth crossovers following overbought tops, such as occurred in 2007 and 2015.
The chart below shows about 85 years of the monthly PMO performance, and for the most part the historical PMO movement confirms the general rule that, when the monthly PMO is below its signal line and falling, a bear market is in progress. Such is the case now.
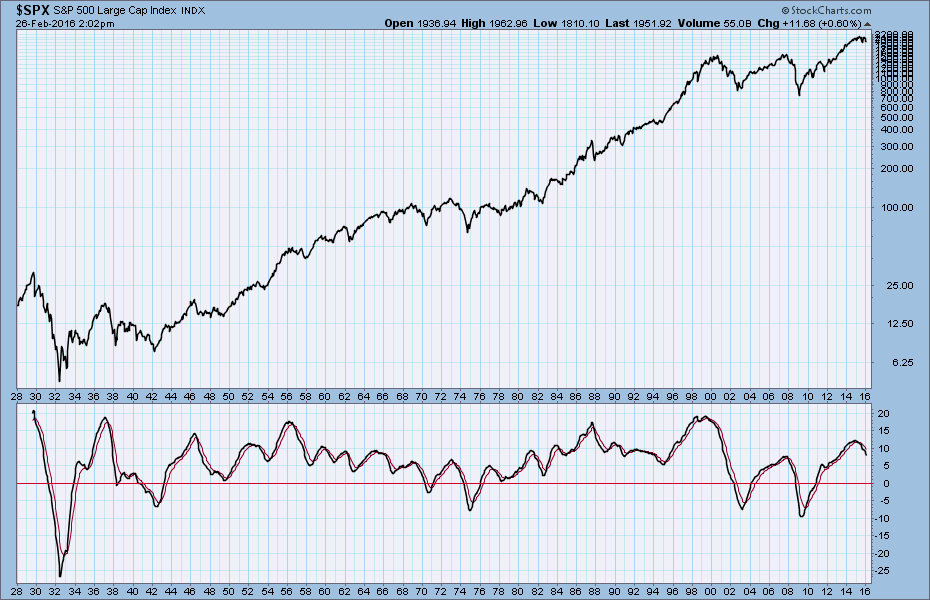
CONCLUSION: Today the monthly PMO confirms many other indications that a bear market is in progress. While it is possible for a reversal to take place, that is not typically what happens with a PMO configuration sporting a smooth PMO top, downside crossover, and extended drawdown, such as we currently have. I anticipate an outcome that resembles the declines from the 2000 and 2007 market tops. That is to say that the monthly PMO should continue downward and possibly cross down through the zero line before a long-term price bottom forms.
Note: Since these are monthly charts, they will not become finalized until the close on Monday, February 29, but it would take a monstrous upside price move to significantly change the picture or my conclusions.
Technical analysis is a windsock, not a crystal ball.