Indicators in all timeframes don't always coordinate with each other, but I believe they are beginning to meld right now. In the member's only DecisionPoint Alert blog, I cover all of these oscillators on separate charts based on the timeframe (i.e. short-term chart, intermediate-term chart, etc). I noticed each timeframe was becoming extremely overbought. It was time to review charts that included all timeframes. You'll find those in the DecisionPoint Trend and Condition ChartPack or you can click on those I've created below and save them to your own ChartList.
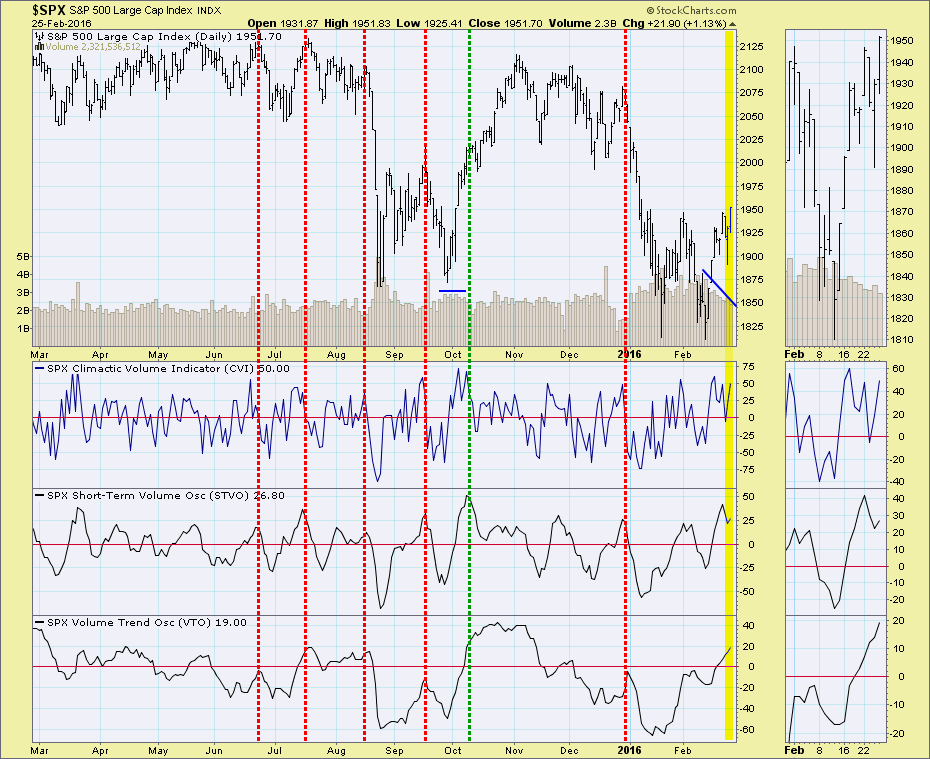
The first chart shows the On Balance Volume Indicator Suite made up of the Climactic Volume Indicator (CVI), Short-Term Volume Oscillator (STVO) and the Volume Trend Oscillator (VTO). As I said, they don't often peak at the same time. Dragging a vertical line across the chart, I marked overbought readings peaking at the same time. The result? A price top. But wait, it's important to point out the green line. There are undeniable similarities in price pattern and indicators that preceded another leg up. However, note volume behavior (blue lines). There is a distinct difference. Volume stayed fairly even during the preceding rally and in this case, volume has been drifting lower.
Here's a three year chart using the Price Momentum Oscillator (PMO), Swenlin Trading Oscillator - Breadth (STO-B) and Intermediate-Term Breadth Momentum Oscillator (ITBM). These indicators don't line up very often. The last yellow bar uses a short-term overbought peak for the ITBM with the same result.
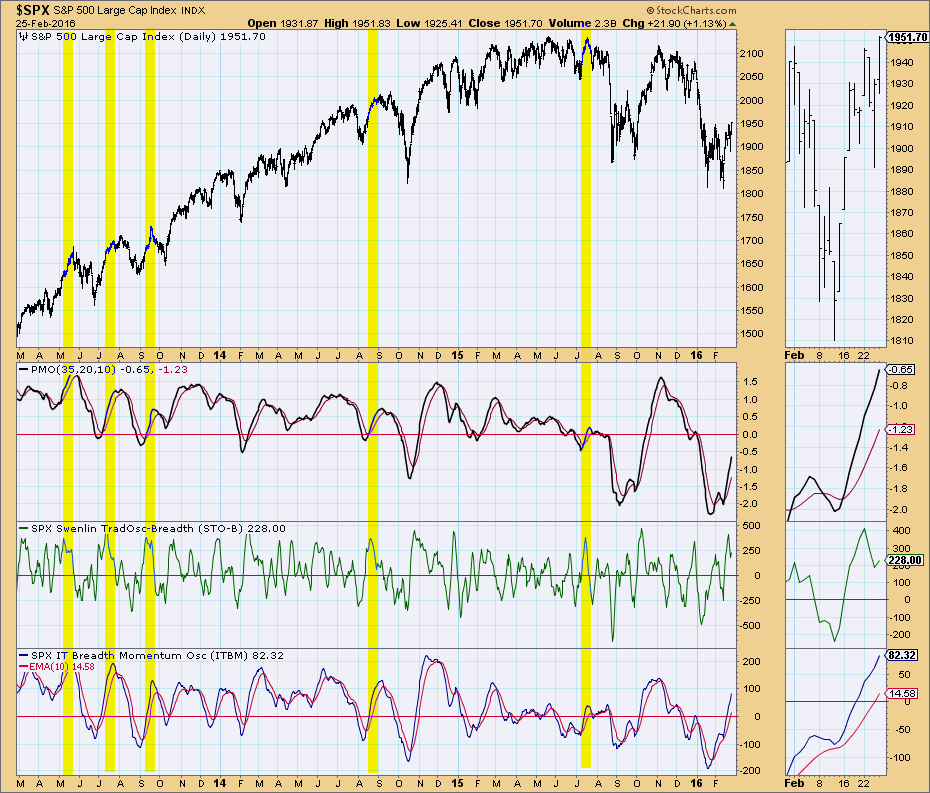
Conclusion: When all three timeframes become this overbought at the same time, we usually see a correction or sizable decline. Last time on the CVI/STVO/VTO chart, it was a continuation rally; however, volume decreasing on the current rally indicates a decline is more likely.
Come check out the DecisionPoint Report with Erin Heim on Wednesdays and Fridays at 7:00p EST, a fast-paced 30-minute review of the current markets mid-week and week-end. The archives and registration links are on the Homepage under “What’s New”.
Technical Analysis is a windsock, not a crystal ball.
Happy Charting!
- Erin


