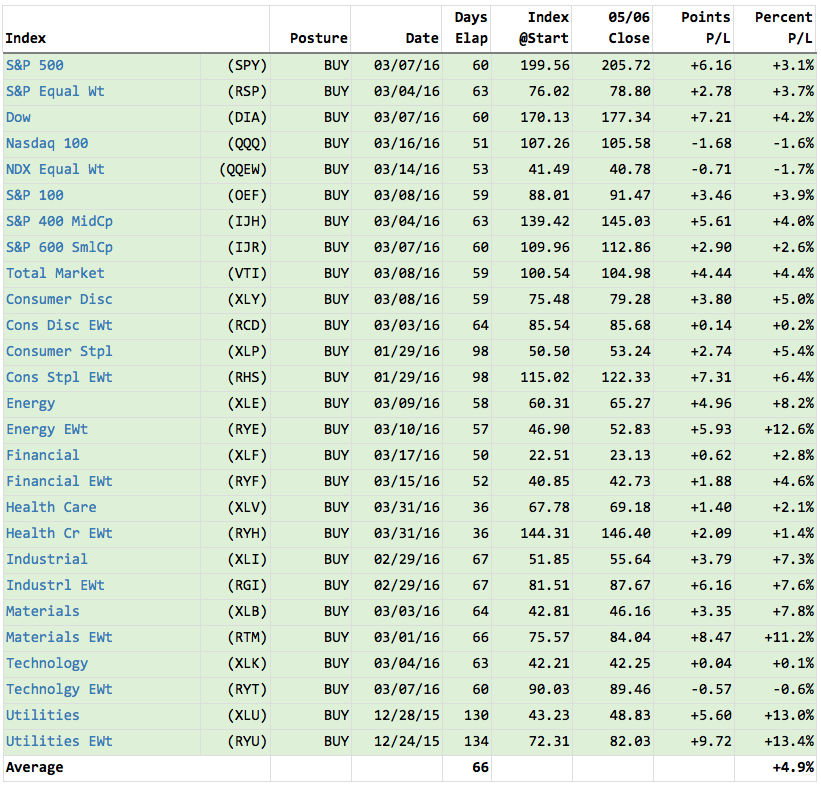
The signal table from the DecisionPoint Alert daily report shows all major market and sector indexes on Trend Model BUY signals, and all but three are profitable, so there is some cushion against the downside. However, this is just a one-dimensional picture of the market status generated by moving average crossovers. We also need to examine the condition of the market, so we can evaluate if this positive picture is likely to persist.
Again, one of my favorite charts shows the percentage of stocks above their 20EMA, 50EMA, and 200EMA. While the above 200EMA index confirmed the April price top, the 50EMA and 20EMA indexes did not, displaying negative divergences. This warns of problems in the shorter-term. All three of the indexes have retreated from overbought levels, there is still plenty of room for them to move lower before they are oversold. There is no certainty that they will move lower, but the potential is there.
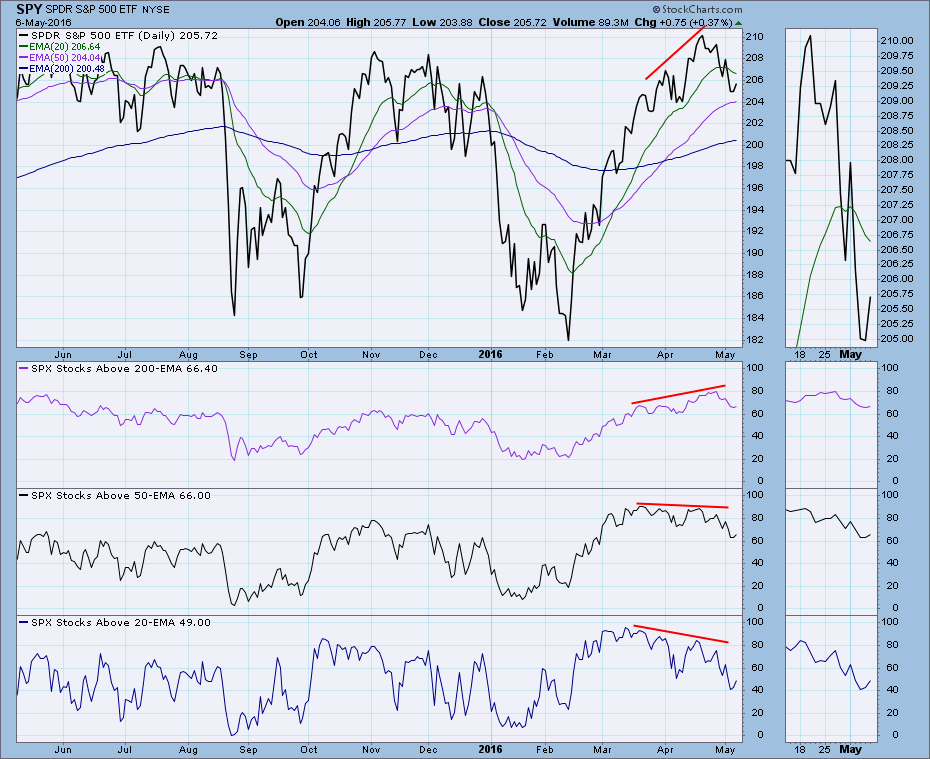
Something else I notice on this chart is that the price topping process for the two prior tops was rather drawn out, taking at least four months last summer, and two months at the end of the year. We may be in for more of that churning before price finally breaks.
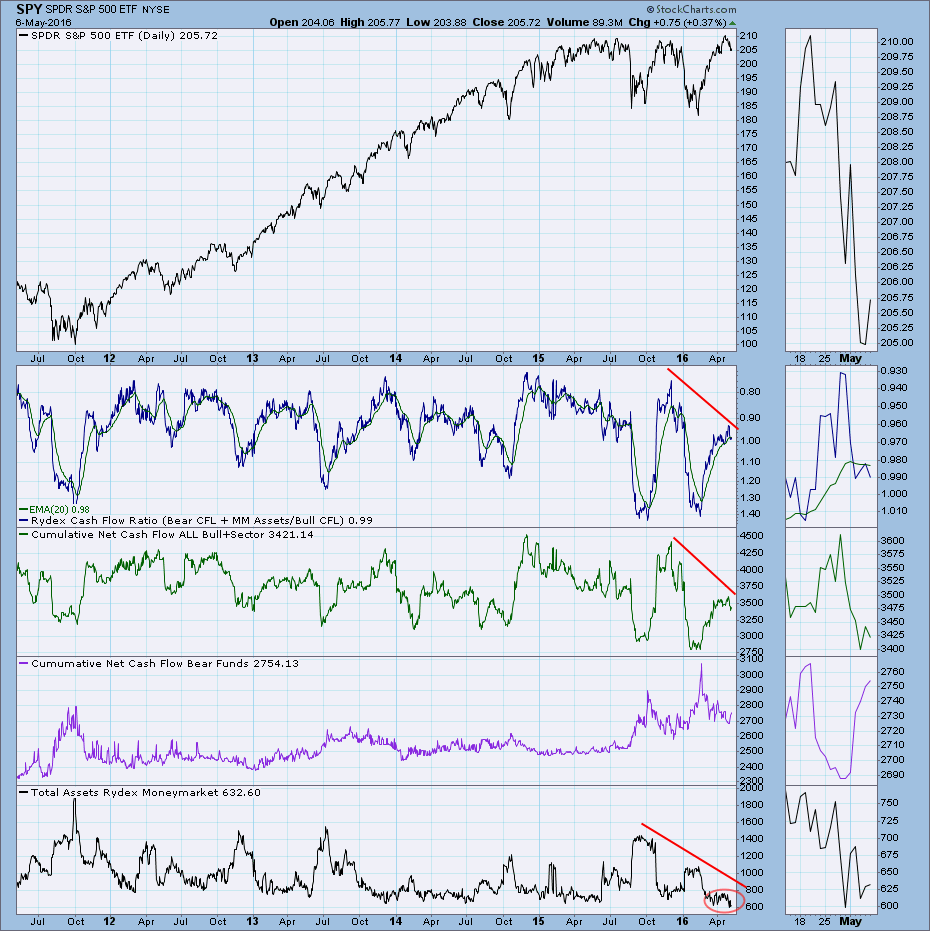
The next chart shows the results of net cash flow into Rydex* bull and bear funds. We can see the negative divergences between price and the indicators, and of particular interest is Net Cash Flow into Bull and Sector funds. It reflects the dearth of volume that accompanied this year's rally.
CONCLUSION: While SPY made new, all-time highs last month, a wide range of indicators show negative divergences against the two most recent market tops. Such divergences do not guarantee a price correction, but that is the most likely outcome.
*Rydex funds were purchased by and now carry the name of Guggenheim; however, we still track the original funds from Rydex and continue to use the Rydex name for the indicators to acknowledge their origin.
Technical analysis is a windsock, not a crystal ball.
