It has been almost a month since my last commentary on gold, at which time I asserted that gold was bullish but vulnerable for a pullback. On the chart below dated May 13 the primary evidence supporting a pullback was that: (1) price had formed a bearish rising wedge, a pattern that normally resolves downward; (2) the PMO had formed a negative divergence against the two price tops in the wedge; and (3) the PMO had crossed down through its signal line, generating a PMO SELL signal.
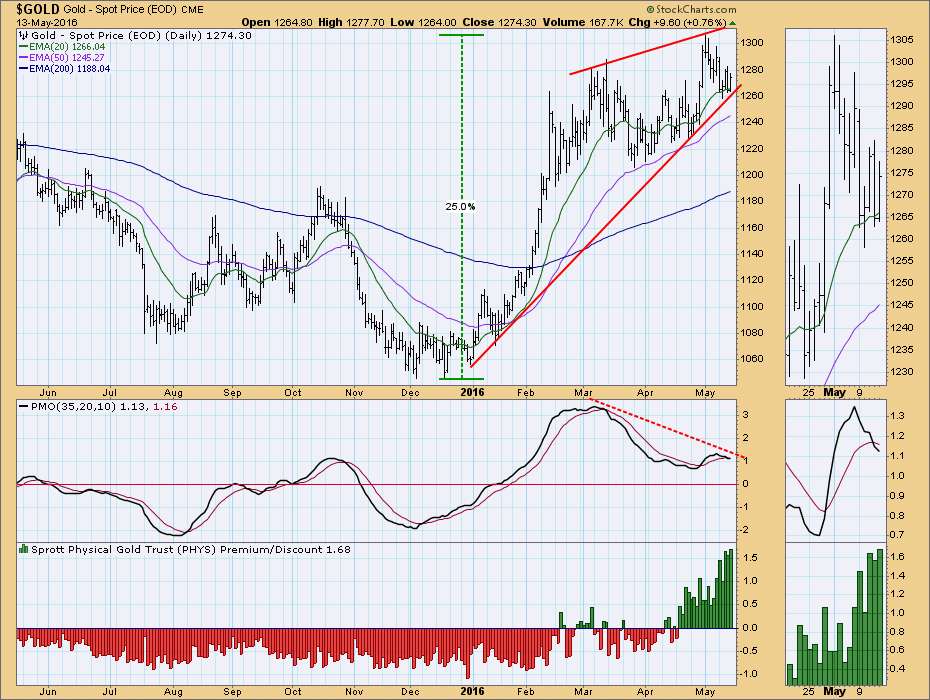
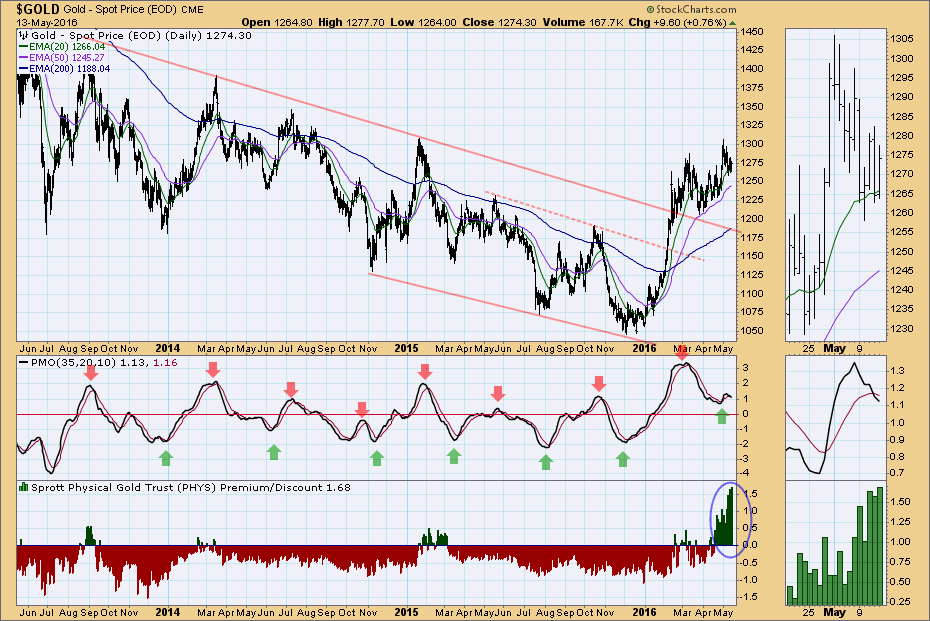
At the time I suggested that a reasonable downside target was about 1180, based upon the support offered by the long-term declining tops line seen on the chart below, also dated May 13.
 So what actually happened? On the current daily chart below we can see that the rising wedge broke down, as expected, and price pulled back to 1200 (not 1180, but close enough). Holy cow! Sometimes this TA stuff actually works!
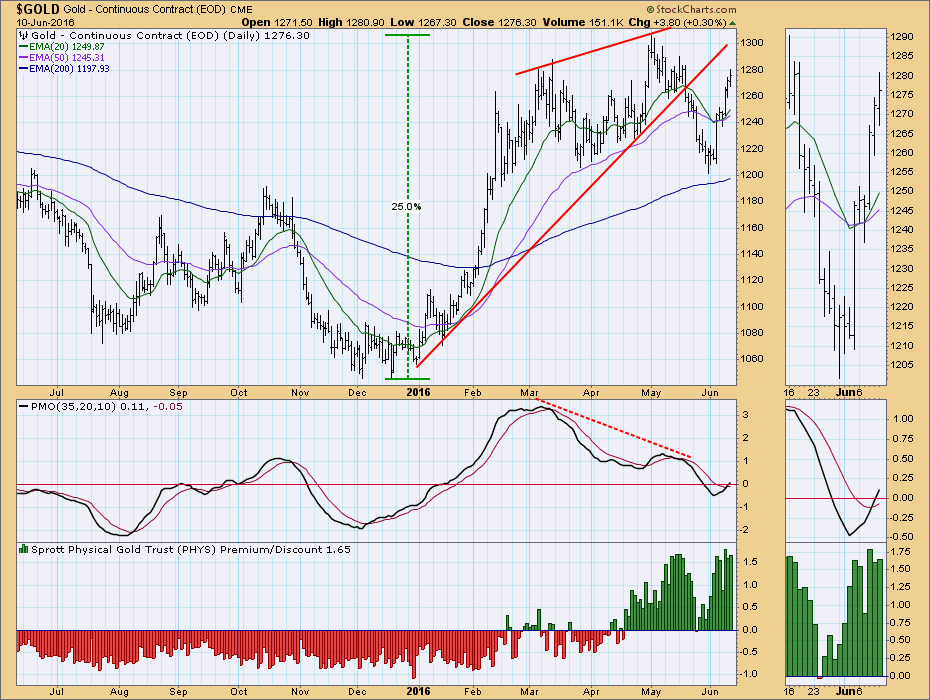 Unfortunately, the price correction was just enough to pull the 20EMA below the 50EMA, which caused the Trend Model to change from BUY to NEUTRAL for a few days; however, the bounce off the correction lows has been strong enough to change the Trend Model back to BUY. Also, the PMO has bottomed and crossed up through its signal line, generating a PMO BUY signal.
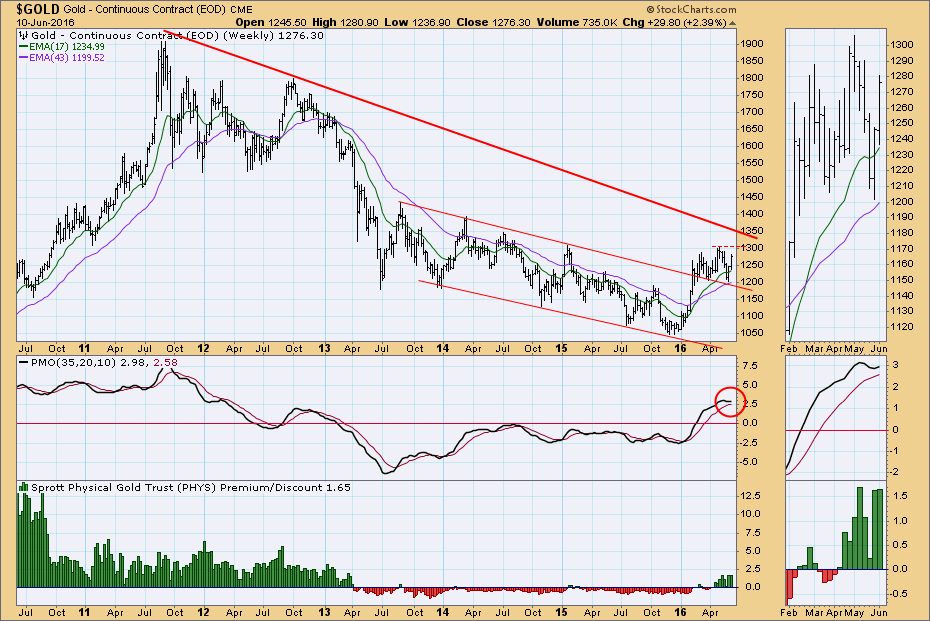
On the weekly chart below we can see that the weekly PMO has turned up, bottoming above its signal line. This is very bullish. There is horizontal resistance at about 1300, but, in my opinion, the next significant resistance will be at around 1350 where price will encounter the long-term declining tops line.
 Finally, the monthly chart was bullish a month ago, and that has not changed. We can see a solid monthly PMO bottom, and the PMO is rising above the signal line. It is my assumption is that a new gold bull market is in progress.
 CONCLUSION: After a minor correction of about -8%, I believe that the advance from the December low has resumed. While the May price top needs to be exceeded to make that official, the PMO status is bullish in all time frames. The next significant challenge will be for price to break above the long-term declining tops line drawn from the 2011 top.
Technical analysis is a windsock, not a crystal ball.


