The S&P 500 Index 2016 first quarter earnings results are in, and it is time once again to take our quarterly look at our earnings chart, which shows the S&P 500 in relation to its normal value range. (Note: The chart is a static graphic, not an active chart.)
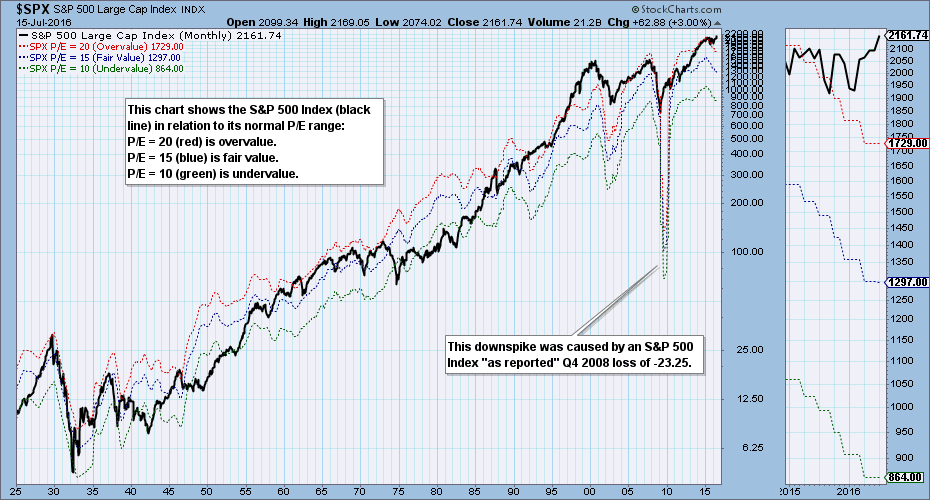
The bands on this chart show where the S&P 500 would be if it had an undervalued P/E of 10 (green), a fair valued P/E of 15 (blue), or an overvalued P/E of 20 (red). While the bands don't rigidly contain the range of the Index, they do help us get a quick visual assessment of the current valuation along with some historical perspective. As a general rule a P/E range of 10 to 20 should be considered normal for a broad market index like the S&P 500. (The percent profit generated with a 20 P/E is 5%; for a P/E of 10 it is 10%.)
The current P/E is 25, which places the Index well above the normal overvalue level of 20. Last quarter the P/E was 24, so the situation is getting worse. To clarify, the S&P 500 is at 2162, which is 25% above the overvalue level of 1729. The current P/E is 50% greater than the normal 10 to 20 point P/E range.
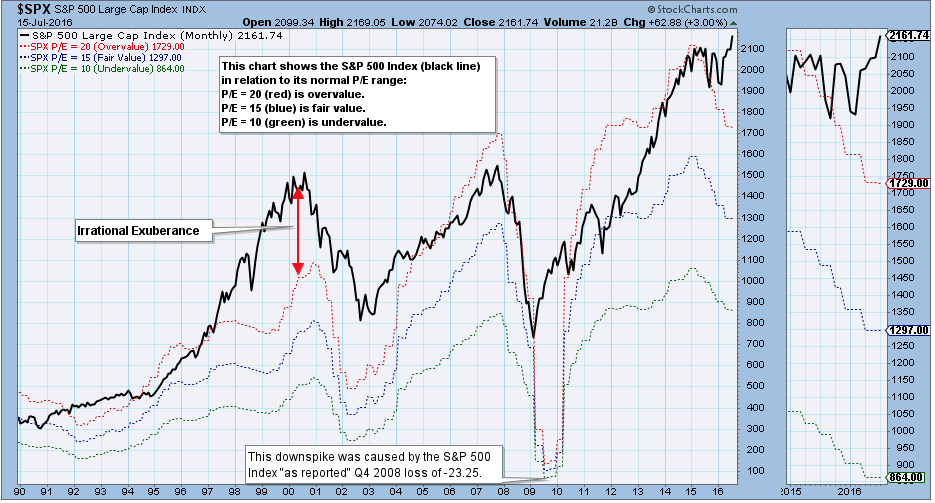
The next chart shows a shorter time frame on a linear scale to give us a better perspective. It is hard to see, but 2016 Q1 earnings were only slightly lower than 2015 Q1, so the bands only ticked down a tiny bit. The problem is that prices have moved higher, and the picture is starting to look like the late-1990s, when irrational exuberance drove the P/E in the neighborhood of 45. In fact, we have a similar environment, with the Fed holding interest rates 'irrationally' low to the benefit of housing and stocks.
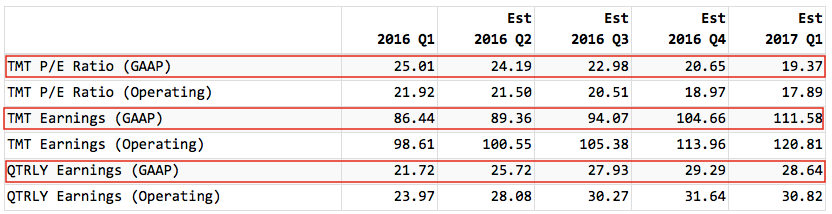
In the table below, twelve month trailing (TMT) earnings are projected to increase over the next four quarters, which in turn will cause the P/E to drop (if the S&P 500 Index value stays the same, which it probably won't). The same move back toward 'normalcy' could be effected by a drop in prices.
 Source: Standardandpoors.com
CONCLUSION: A close examination of the charts will reveal that prices are not always contained by the normal fundamental limits. Currently, the market is very overvalued and is moving opposite the direction needed to achieve a rational relationship between price and value. This situation is a negative force working against the market, but it can continue indefinitely and get worse. We know it will end badly, but right now the technicals say that the market doesn't seem to care.
Technical analysis is a windsock, not a crystal ball.


