The stock market has been trading in an extremely narrow range for almost two months. During that time I have mostly attributed this unusual action to the ambivalence of the Fed: "We really want to raise interest rates, except we really don't want to raise interest rates. Standby for immediate action." I knew that there were some election jitters factored in there, but I'm beginning to think it's more about the election than the Fed.
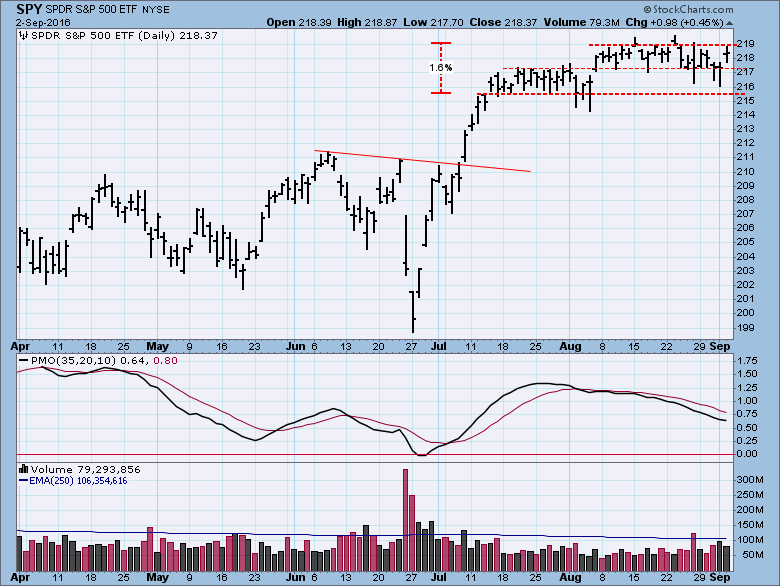
Here's a SPY chart that emphasizes what we have been enduring of late--a 1.5% trading range, divided by two ranges of about 0.75%. Give me a break.
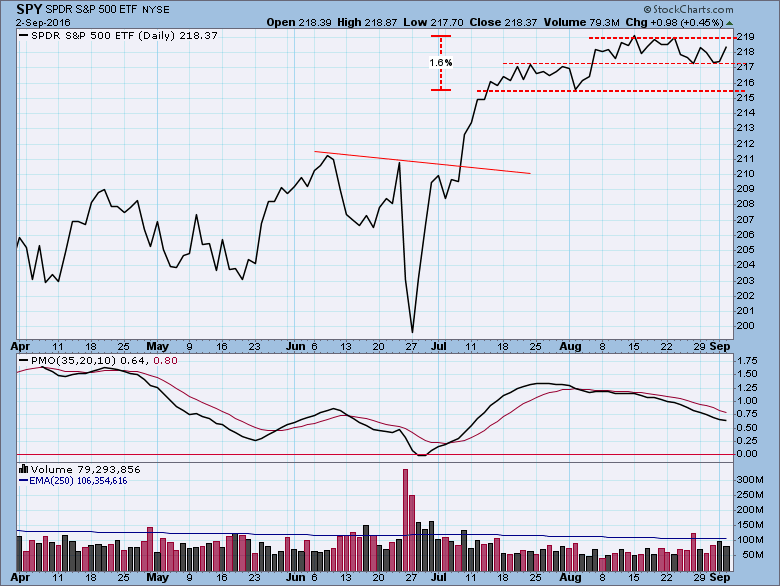
Okay, there are minor excursions out of range boundaries, but a line chart shows why I chose to emphasize the more narrow formation. (I didn't adjust the annotations for the line format.)
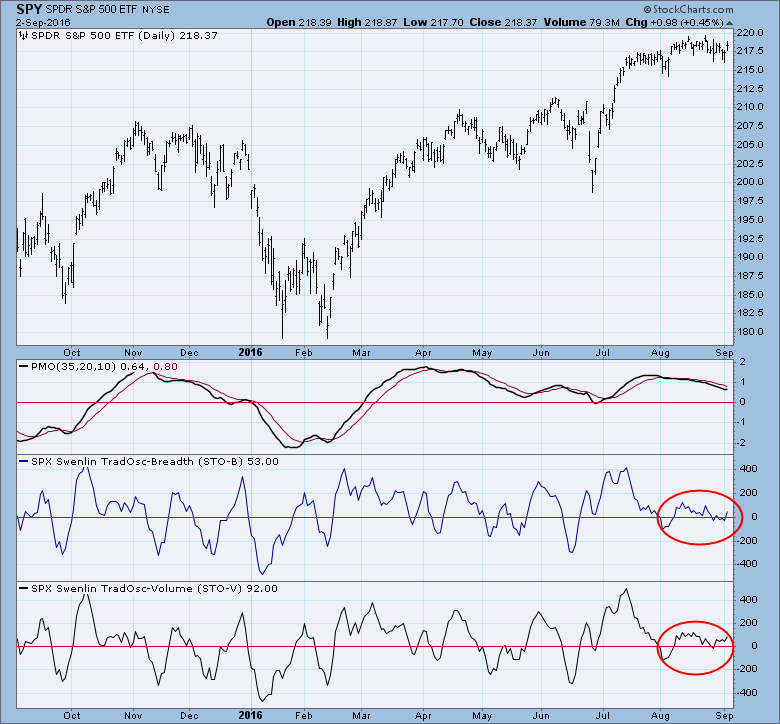
One resulting problem is that narrow sideways price movement drives indicators back to their zero line. Actually, they are not driven as much as they drift into neutral, lacking any pressure from up or down price action. The short-term indicator chart below shows how the indicators have settled in the neutral zone, and they do not betray any up or down bias. They are waiting for something to happen.
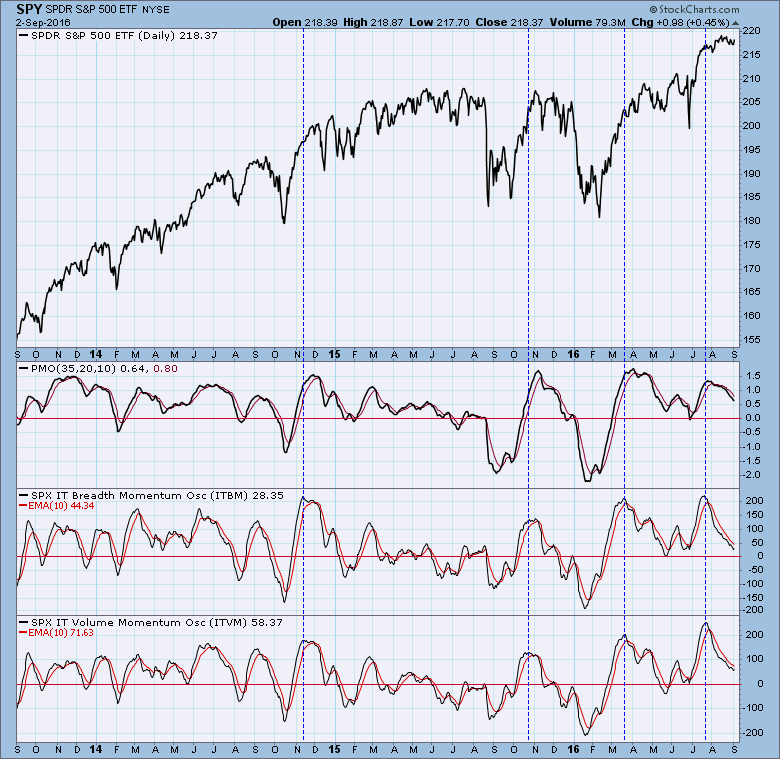
Medium-term indicators below have drifted back to neutral, although my inclination is to conclude that they show how internals are undermining the price consolidation, making the market vulnerable to a pullback. Combining this view with the knowledge that September and October are seasonally very negative months, I would not be betting on the upside for the next few months unless something changes.
CONCLUSION: I have a rule: If the title of an article poses a question, answer the darned question in the article! Occasionally, as now, I have to break the rule, because I don't have an answer. If the market really is waiting for election results, it may continue in the tight sideways band. So far it seems that somebody has been working hard to make it so. Otherwise, I'd be wary of the negative seasonality tendencies and weak medium-term technicals.
Erin will be presenting at ChartCon 2016 this month. Her focus will be on how to develop a personal timing model based upon DecisionPoint indicators. Click here to register.
Technical analysis is a windsock, not a crystal ball.


