Gold had a bad week, decisively breaking down through a rising trend line drawn from the December low. Note that the PMO crossed down through its signal line (PMO SELL signal) a few days before the price break, and the 20EMA crossed down through the 50EMA (IT Trend Model NEUTRAL signal) the day after the rising trend line was penetrated. The 50EMA is above the 200EMA, so I consider that gold is still in a bull market, albeit correcting.
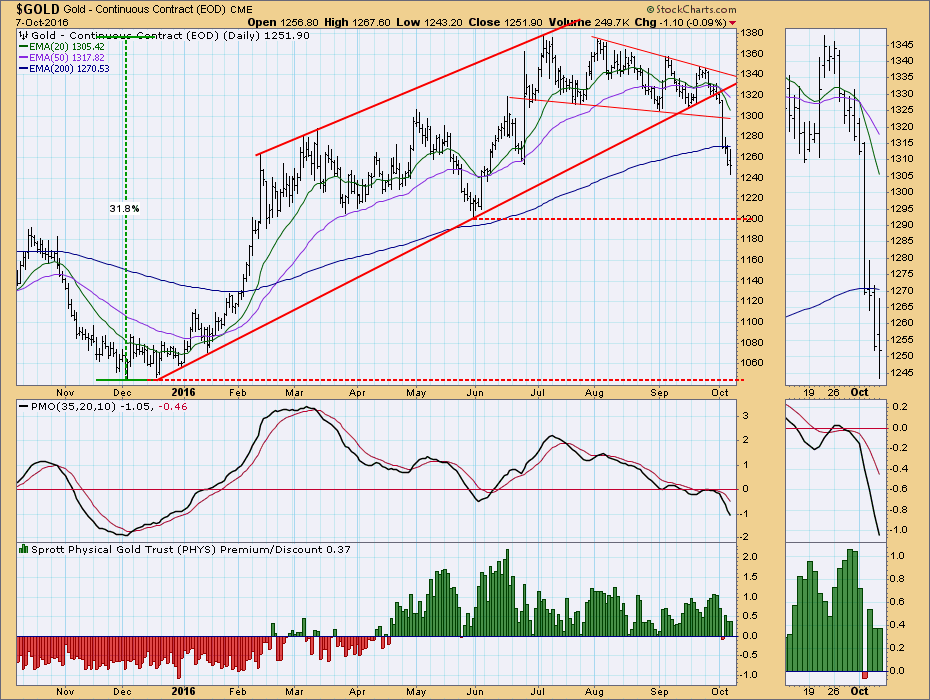
Price is currently in a zone of congestion created by the price movement between February and May, and it could theoretically find a correction bottom at any time; however, the next most obvious support is found at the line drawn from the May low at 1200. The most critical support is at 1047, which marked the end of the gold bear market in December.
To gauge the sentiment for gold, the bottom panel on the chart shows the premium/discount for Sprott Physical Gold Trust (PHYS), a closed-end fund that owns physical gold. When PHYS is selling at a premium (green bars), sentiment is bullish.
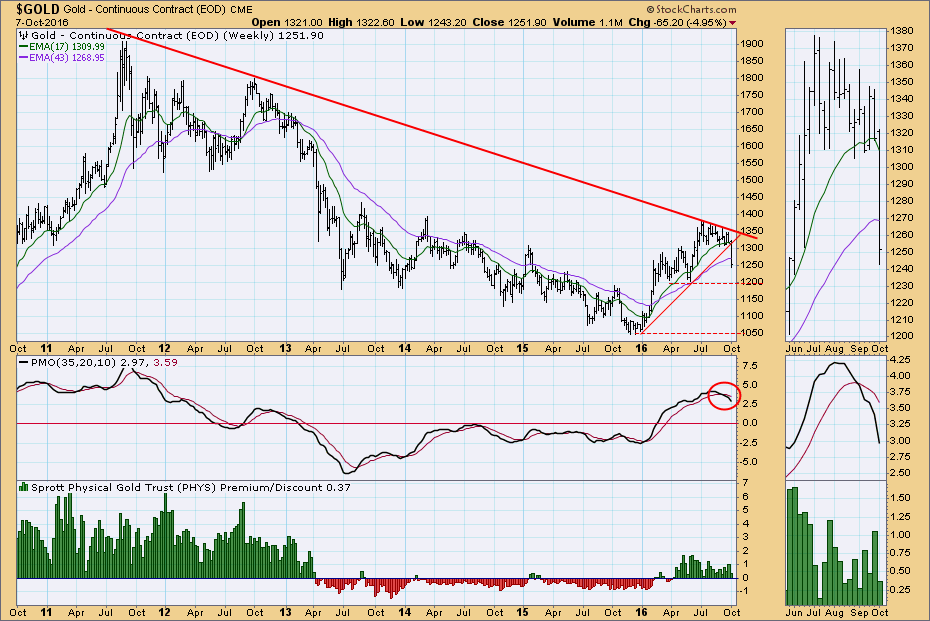
The weekly chart below shows that a weekly PMO SELL signal was generated about three weeks before the break. This is very bearish in this time frame, and the weekly PMO needs to bottom before the outlook can improve. Note that the December price low marked the end of a four-year bear market for gold.
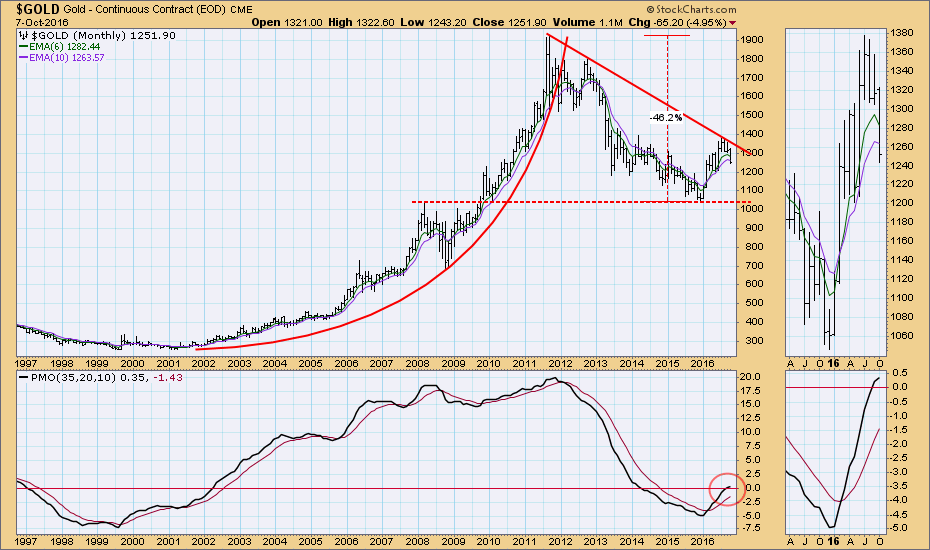
The monthly chart below shows the parabolic rise from the 2001 lows, followed by a decline of nearly 50% from the 2011 top. This perspective really emphasizes the importance of the support line at 1047. The monthly PMO has decelerated, but is still rising, so gold remains bullish in this time frame. However, price has been stopped by the long-term declining tops line.
CONCLUSION: After a +30% advance from the bear market lows, gold has entered a correction phase. I am interpreting this correction as a pullback necessary to prepare for a successful assault against important overhead resistance. While it is possible for the correction to reach as low as 1047 (or lower, for that matter), it is desirable that the support at 1200 be able to hold.
Technical analysis is a windsock, not a crystal ball.