On Friday gold entered a bear market when the 50EMA crossed down through the 200EMA. The preceding bull market began with a rally off the December 2015 lows and hit its high in July after a more than +30% advance. From there it went into correction mode for five months, then slid into bear mode with the 50/200 sell signal. An important line of support at about 1200 was violated a day before.
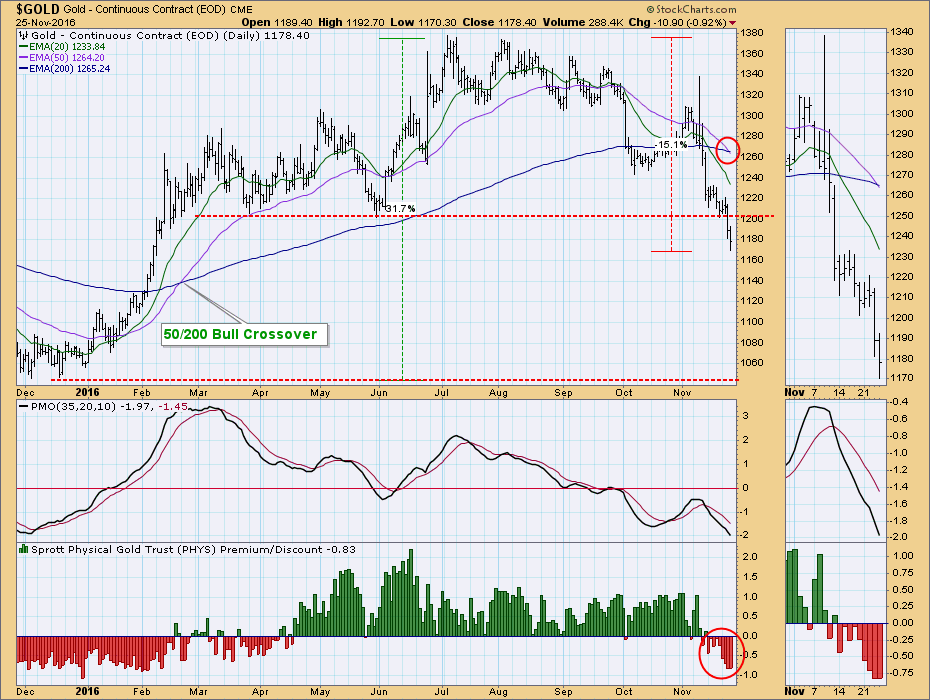
Another serious technical sign is that the Sprott Physical Gold Trust (PHYS), a closed-end fund, recently began selling at a discount. This shows that sentiment has turned bearish, and that sellers are anxious to unload their shares.
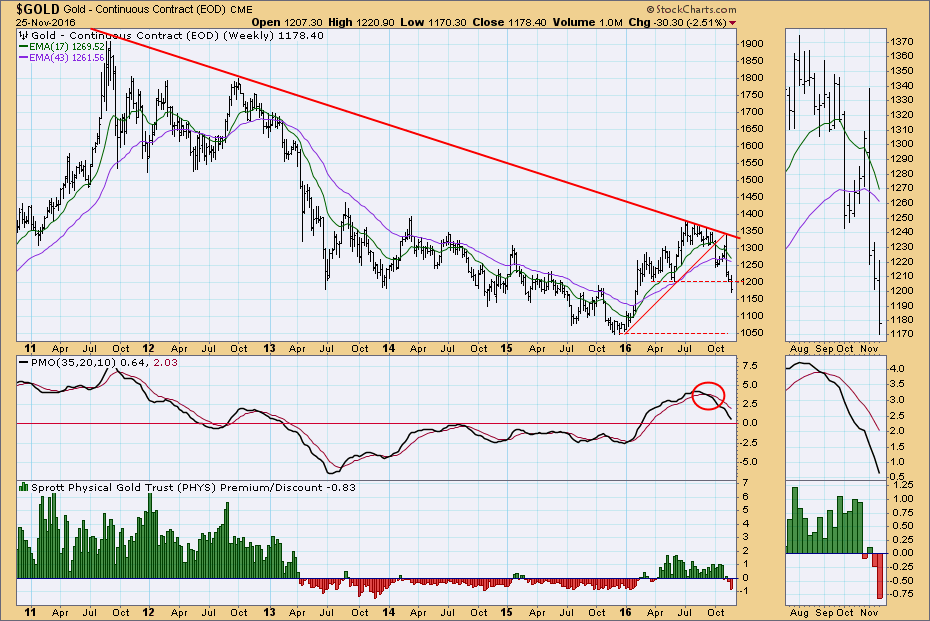
The weekly chart gives us a better perspective, showing the previous bear market in its entirety (from the September 2011 top to the December 2015 bottom). Note how the recent bull market was stopped by the declining tops line drawn from the 2011 top. Note also that the weekly PMO crossed down through its signal line well ahead of the recent collapse. While sentiment was bullish for most of this year, it never reached the high levels of confidence seen in 2011 and 2012.
The monthly chart will not be final until the end of November, but we are almost there and we can see that the monthly PMO has topped. This is long-term bearish, and there is no rational scenario possible that can prevent that top in the next three trading days.
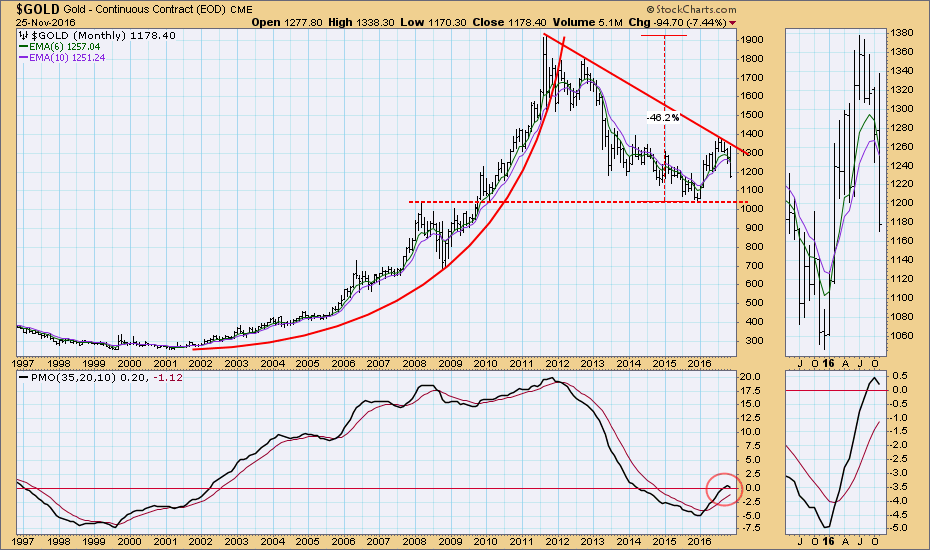
CONCLUSION: Gold has turned bearish in the long term. The 50/200EMA downside crossover, and the monthly PMO top are strong negative signs that will be hard to reverse. These are considered to be long-term signals that can last from months to years. It is not impossible for them to reverse in a fairly short time, but that should not be our primary expectation. At this point the most obvious downside target would be to retest the long-term support at 1050, the level at which the previous bear market ended.
The NEW DecisionPoint LIVE public ChartList has launched! Click on the link and you'll find webinar charts annotated just before the program. Additional "chart spotlights" will be included at the top of the list. Be sure and bookmark it!
Come check out the DecisionPoint Report with Erin Heim on Wednesdays and Fridays at 7:00p EST, a fast-paced 30-minute review of the current markets mid-week and week-end. The archives and registration links are on the Homepage under “Webinars”.
Technical Analysis is a windsock, not a crystal ball.
Happy Charting!
- Carl