 Yale Hirsch was the first to propose, "As the Standard & Poor's goes in January, so goes the year". Simply meaning, if the S&P 500 closes higher in January, the end of the year should finish higher OR if it closes lower, it will close lower on the year. There are mixed reviews regarding the January Barometer. In fact, The Wall Street Journal published an article on January 8, 2017 titled, "Sorry, the 'January Barometer' Is a Market Myth".
According to Charles Kirkpatrick and Julie Dahlquist in their book, Technical Analysis: The Complete Resource for Financial Market Technicians, statistical problems do arise. The January Barometer is within normal statistical probabilities, so it doesn't seem to have true predictive power.
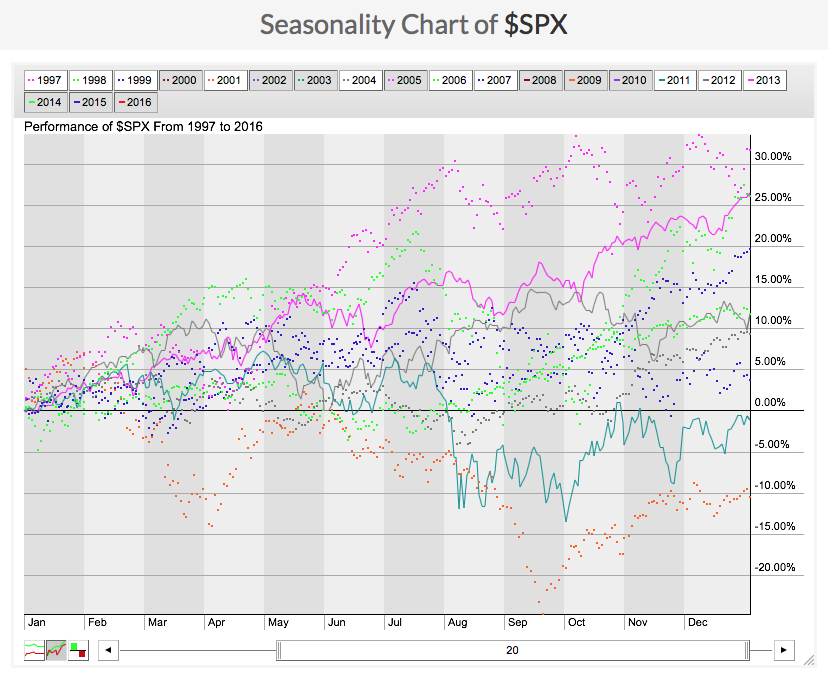
The Seasonality Tool, available for free on StockCharts.com, shows us visually how the S&P 500 performed over the past 20 years.
Here are the years that the S&P 500 closed higher in the month of January. Of those ten years, the market closed lower twice. That's an 80% accuracy rating which is not bad. January 2017 was a banner month with the SPX closing up nearly 1.8%, so there is a reasonable probability that we will finish the year higher. 2017 probably has better odds given that January gave us this large head start.
Below are the ten years where the market closed lower in the month of January. Of those ten years, the market closed lower only four times. That's an accuracy of only 40%. You should note when looking at this chart versus the one above, that returns, while higher at the end of the year, were far less impressive than those where the market finished January higher. Additionally, the worst losses were taken when January began with a deficit.
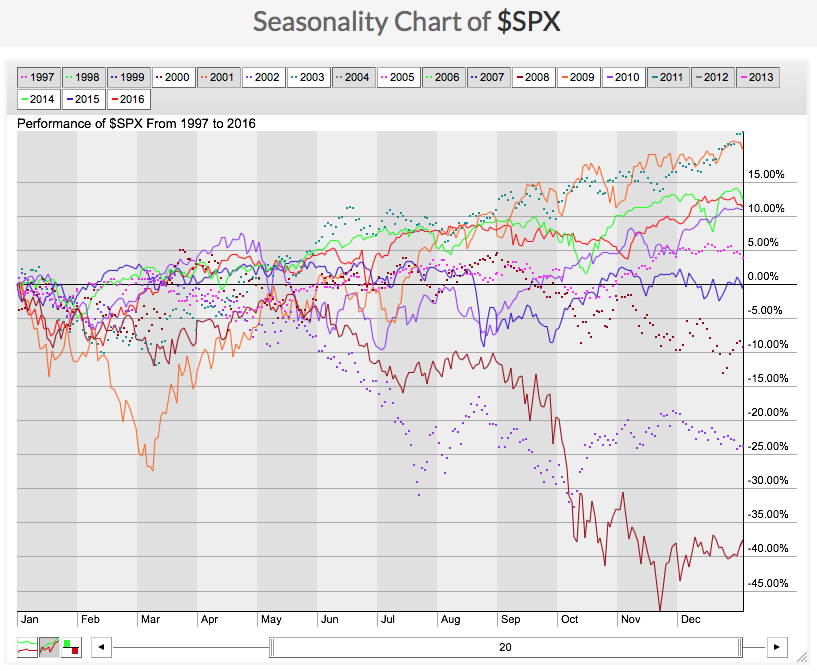
Conclusion: Granted, this article extrapolates conclusions about the January Barometer since we are looking at only the past 20 years, but some broad conclusions can still be made. If the market closes up in January, you have a higher probability of finishing the year making money at likely a higher return than when January is down. The problem arises when it is down in January, because it is right less than half of the time. Additionally, the charts shows heavier losses on a negative January and not necessarily great gains even when if the Barometer is wrong and the market closes up.
The NEW DecisionPoint LIVE public ChartList has launched! Click on the link and you'll find webinar charts annotated just before the program. Additional "chart spotlights" will be included at the top of the list. Be sure and bookmark it!
Come check out the DecisionPoint Report with Erin Heim on Wednesdays and Fridays at 7:00p EST, a fast-paced 30-minute review of the current markets mid-week and week-end. The archives and registration links are on the Homepage under “Webinars”.
Technical Analysis is a windsock, not a crystal ball.
Happy Charting!
- Erin