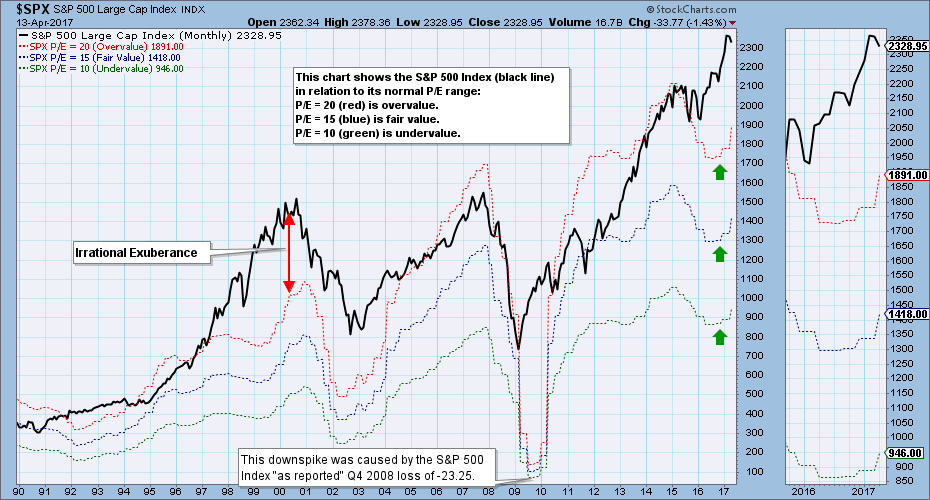
S&P 500 earnings results for 2016 Q4 are in, and the market is still grossly overvalued. The chart below shows the S&P 500 Index (black line) in relation to where it would be if it were undervalued (green line), fair value (blue line), or overvalued (red line). The current price is far above overvalue side of the range, because the S&P 500 has a P/E of 25. Earnings are expected to grow by +26% by the end of 2017 Q4, which would drop the P/E to 20, but only if price goes no higher. If the bull market advance continues, overvaluation will continue to be a problem.
The DecisionPoint Weekly Wrap presents an end-of-week assessment of the trend and condition of the stock market (S&P 500), the U.S. Dollar, Gold, Crude Oil, and Bonds.
*** IMPORTANT NOTE: We are making some changes to our DecisionPoint blogs and webinars starting on April 1st. Click here for more details. ***
STOCKS: Based upon a 11/15/2016 Intermediate-Term Trend Model BUY signal, our current intermediate-term market posture for the S&P 500 (SPY) is bullish. The Long-Term Trend Model, which informs our long-term outlook, is on a BUY signal as of 4/1/2016 so our long-term posture is bullish.
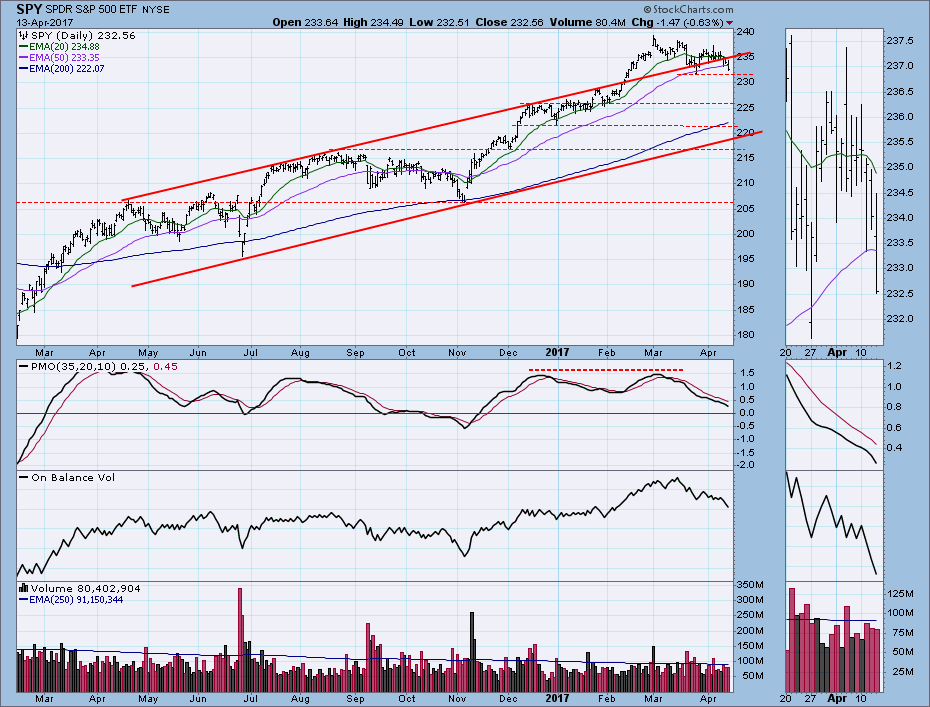
The correction continued to grind on into its seventh week. It is still possible for the bottom to fall out, but I don't expect that to happen barring any seriously adverse news.
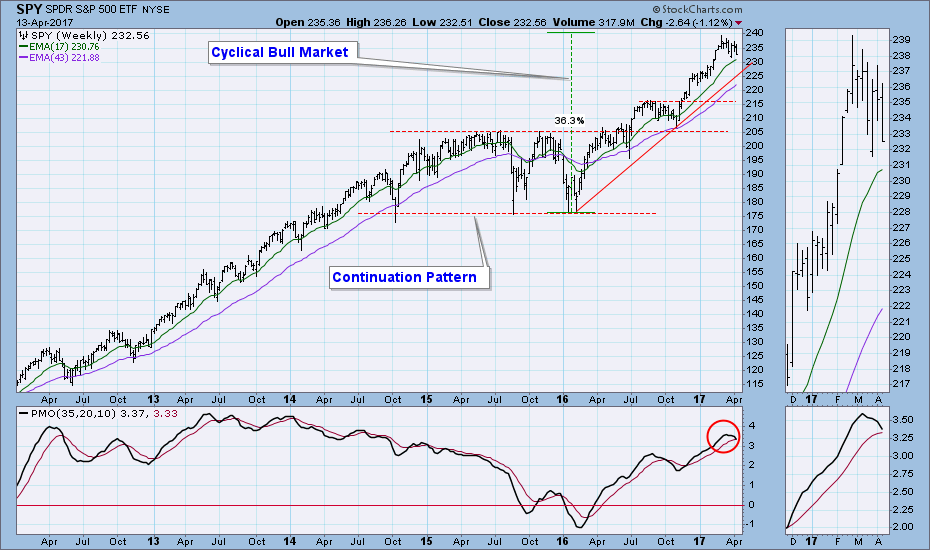
Even if the correction goes deeper than the first line of daily chart support, the weekly chart shows a lot of room before price reaches the rising trend line, which so far has defined the current cyclical bull market. As long as the trend line is not violated, I will not be concerned if the weekly PMO (Price Momentum Oscillator) crosses down through its signal line.
Short-Term Indicators: These indicators are not much use at this time because they have been squeezed into a narrow range, and we don't get the extreme overbought/oversold readings that really attract our attention.
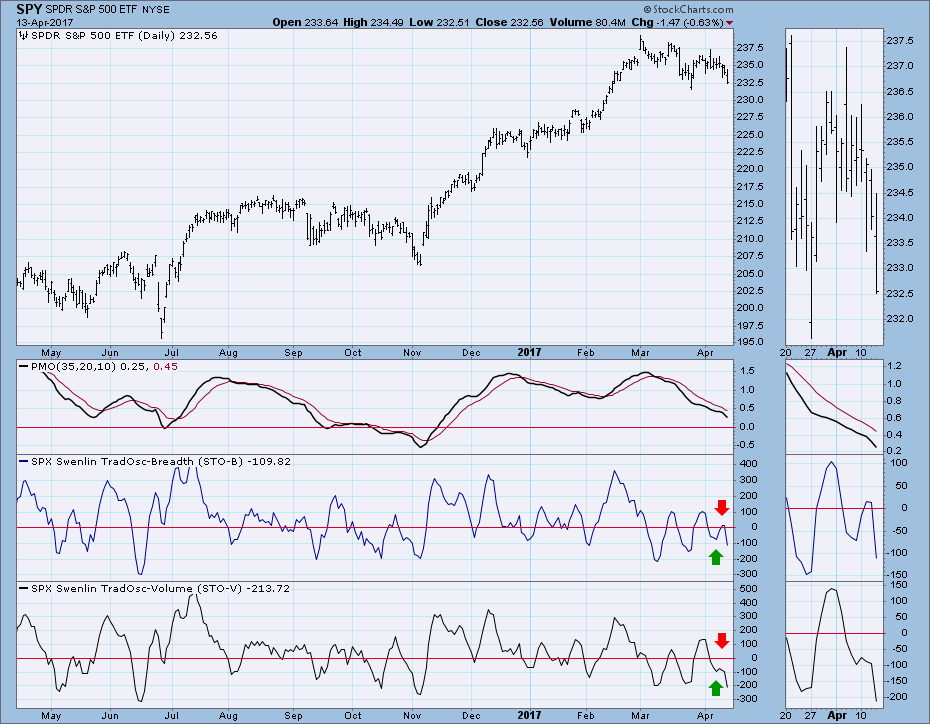
Intermediate-Term Indicators: In a bull market I don't normally expect to see readings very far below the zero line in this time frame. The current complex bottoms make me alert to the possibility of a new rally.
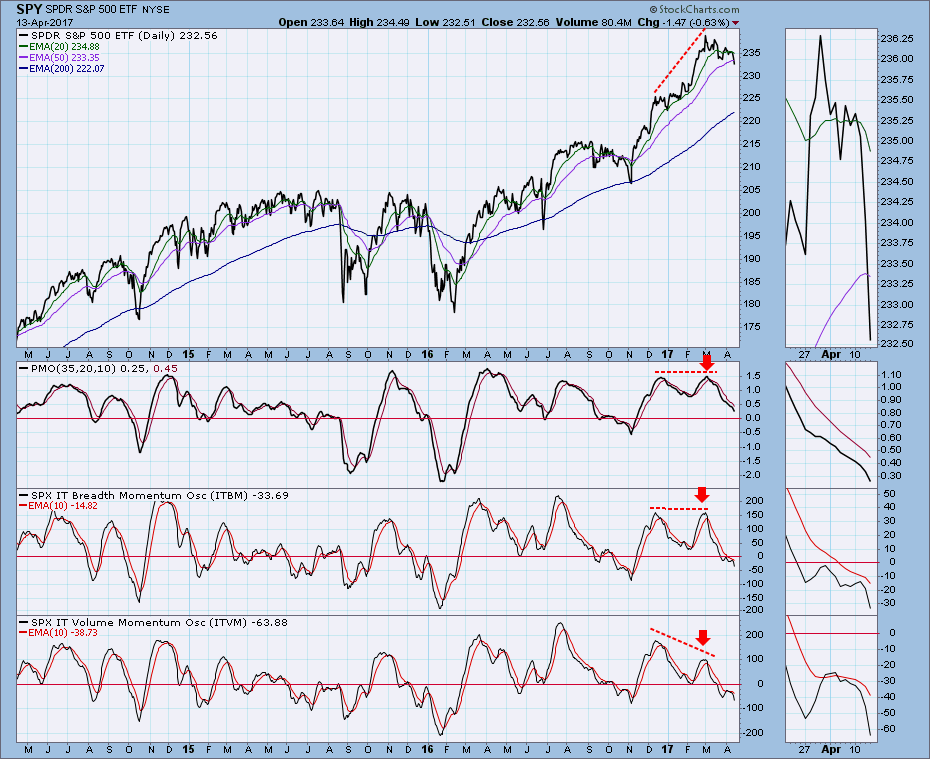
Conclusion: We are in a cyclical bull market within a longer-term secular bull market. The overvalued condition discussed above creates a fundamentally negative context, but it doesn't cry out for immediate remediation. The current correction has not done much price damage at all, with a price decline of only -3.3%. Intermediate-term indicators reveal sufficient internal correction to justify a new leg up. The first necessary signal that the correction is over would be for the daily PMO to turn up.
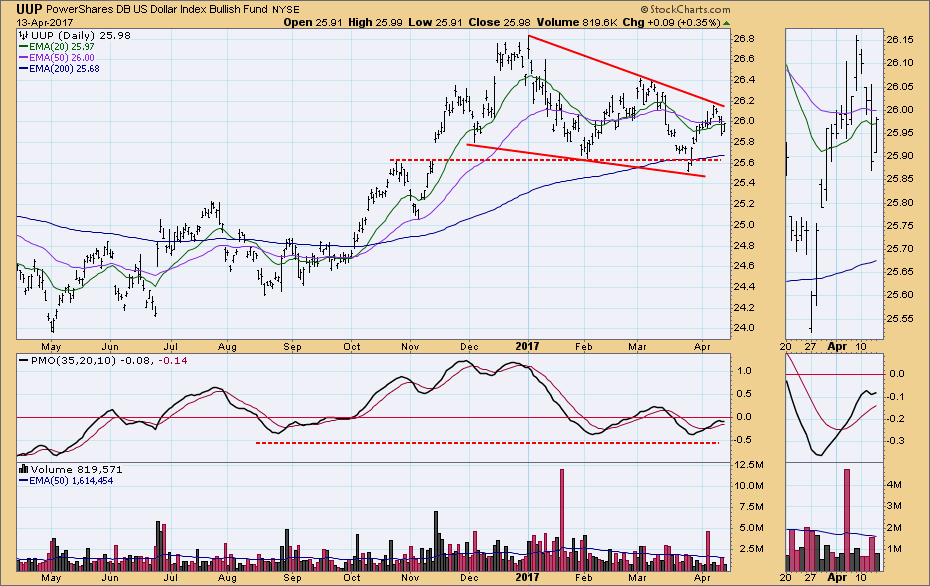
DOLLAR: As of 3/21/2017 the US Dollar Index ETF (UUP) is on an Intermediate-Term Trend Model Neutral signal. The Long-Term Trend Model, which informs our long-term outlook, is on a BUY signal as of 10/17/2016, so our long-term posture is bullish.
President Trump softened his stance regarding China's currency manipulation, and said that the U.S. dollar was getting too strong. Looking at the chart below, we can see that UUP turned down from a declining tops line, which was technically expected. Otherwise, it would appear that a new fundamental drag has been applied.
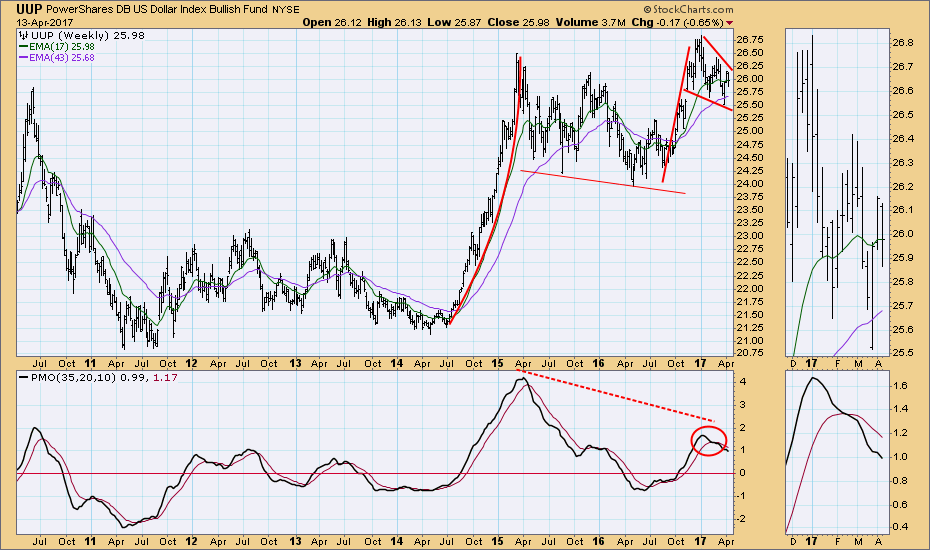
The weekly chart still carries the PMO negative divergence, as well as the PMO Sell signal (PMO falling below its signal line). Price, however, is positive with a bullish flag formation.
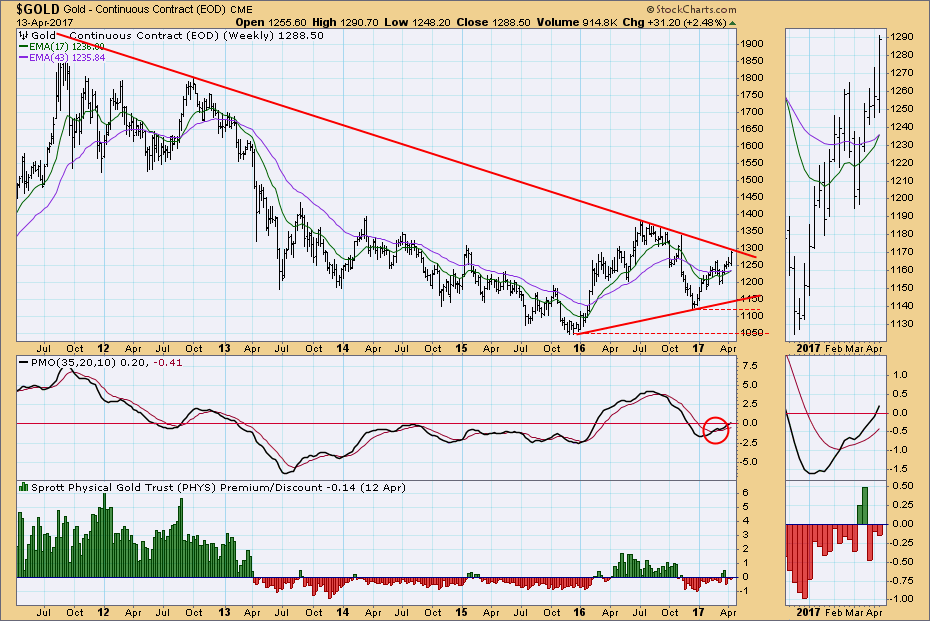
GOLD: As of 2/3/2016 Gold is on an Intermediate-Term Trend Model BUY signal. The Long-Term Trend Model, which informs our long-term outlook, is on a BUY signal as of 4/12/2017, so our long-term posture is bullish.
On Wednesday the Long-Term Trend Model switched from SELL to BUY, and also price broke above the resistance line drawn from the February high. The technical picture looks good, but sentiment remains neutral, reflecting that buyers are not yet sold on gold's upside potential.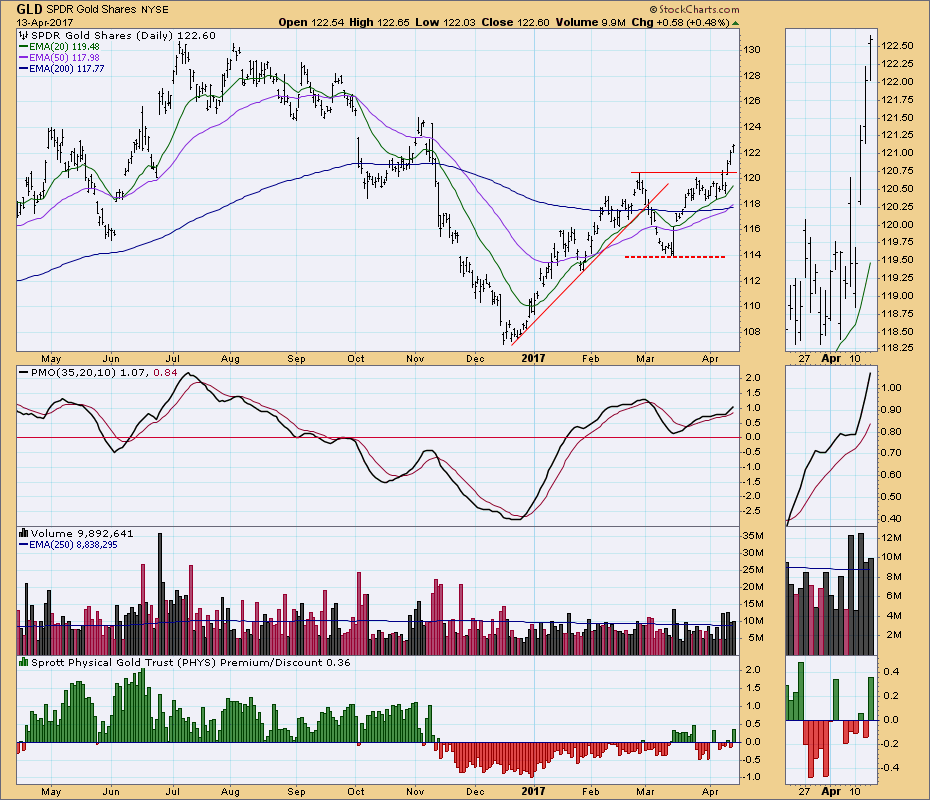
The weekly chart shows price challenging the long-term declining tops line, and the PMO is above its signal line and rising. A price breakout would be significant for the bulls.
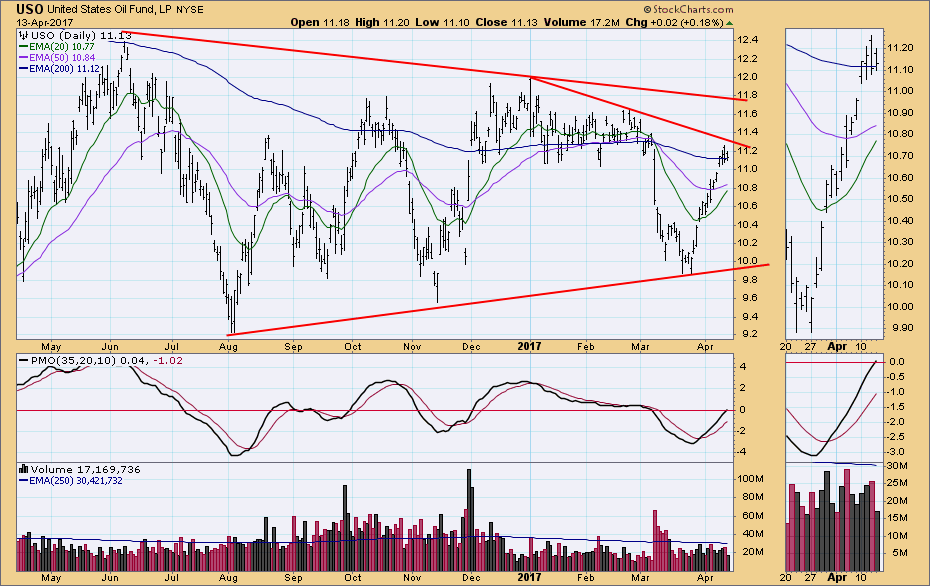
CRUDE OIL (USO): As of 3/8/2017 United States Oil Fund (USO) is on an Intermediate-Term Trend Model Neutral signal. The Long-Term Trend Model, which informs our long-term outlook, is on a SELL signal as of 3/9/2017, so our long-term posture is bearish.
USO has stalled just below a short-term declining tops line. The 20EMA is close to crossing up through the 50EMA, which would generate an IT Trend Model BUY signal. There have been five ITTM whipsaw signal changes in less than 10 months, because price is in a trading range. I would not take a new BUY signal too seriously.
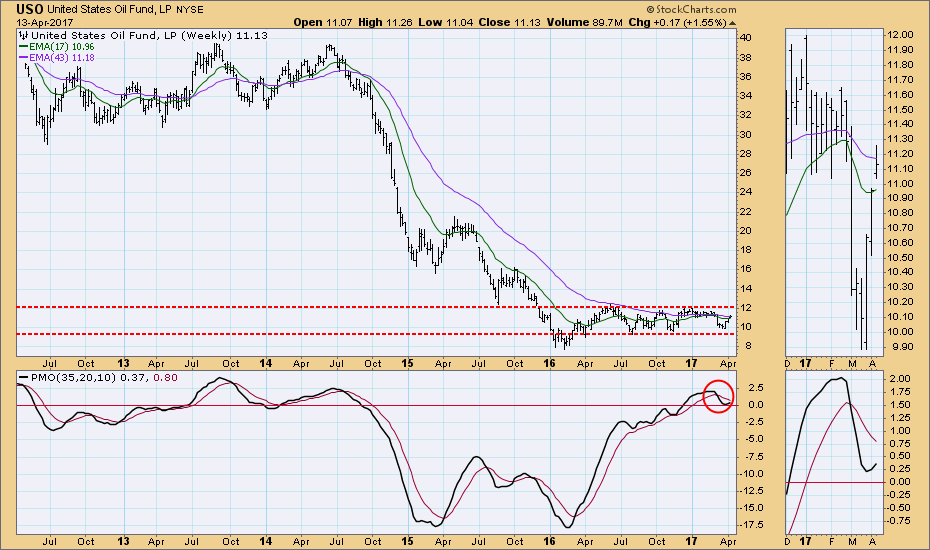
On the weekly chart we can see the major collapse from the 2014 top. USO is now in a basing pattern that could last for years.
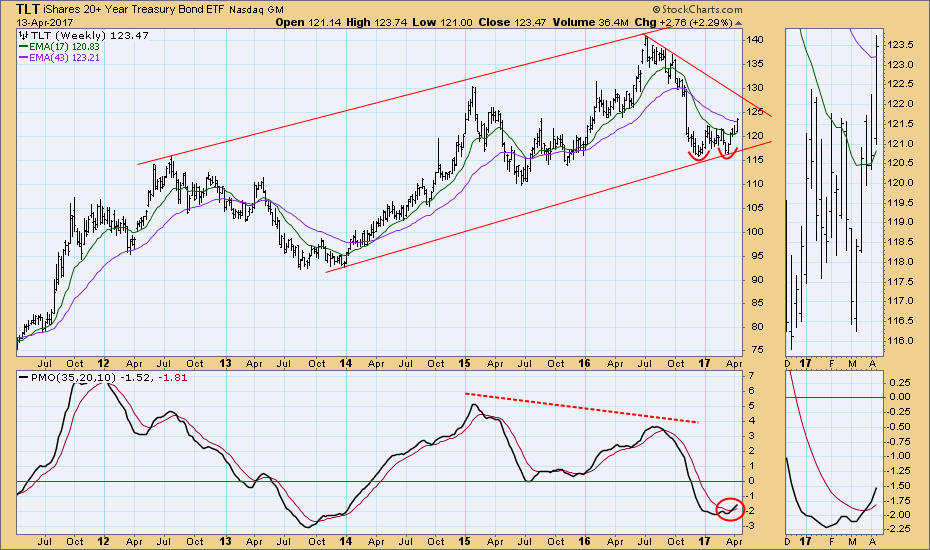
BONDS (TLT): As of 3/31/2017 the 20+ Year T-Bonds ETF (TLT) is on an Intermediate-Term Trend Model BUY signal. The Long-Term Trend Model, which informs our long-term outlook, is on a SELL signal as of 11/17/2016, so our long-term posture is bearish.
President Trump expressed a preference for low interest rates, and TLT broke above the confirmation line of a double bottom. Price must move to about 125.60 for the breakout to be 'decisive,' and the double bottom minimum upside target is about 128.00.
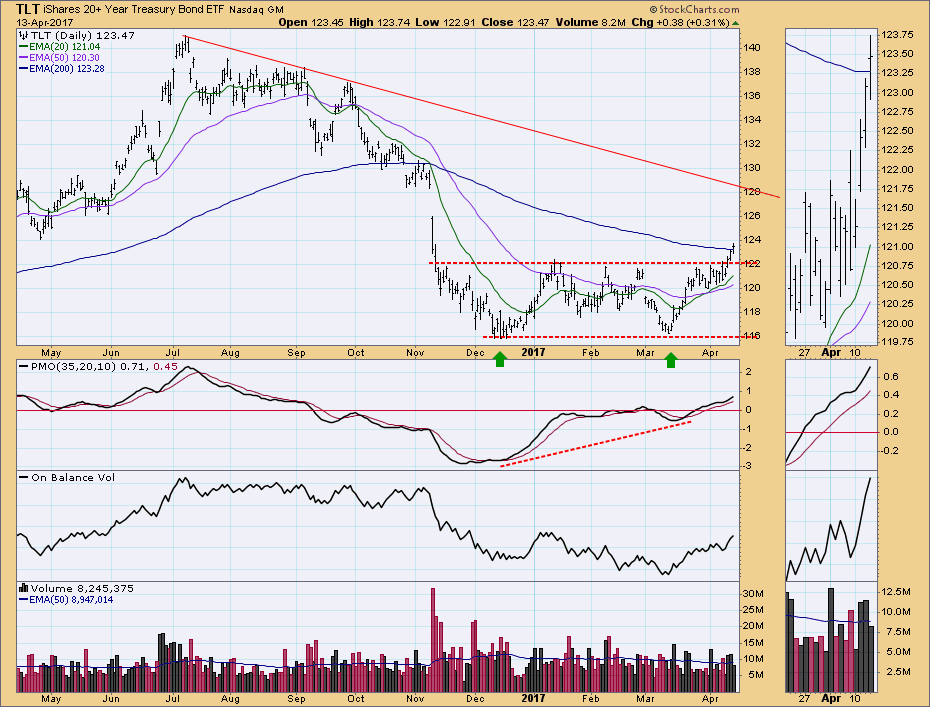
The weekly PMO is above its signal line and rising, and price remains in a rising trend channel, which is partially defined by the most recent bottom. The PMO negative divergence is the one negative on the chart.
NOTE: The signal status reported herein is based upon mechanical trading model signals, specifically, the DecisionPoint Trend Model. They define the implied bias of the price index based upon moving average relationships, but they do not necessarily call for a specific action. They are information flags that should prompt chart review. Further, they do not call for continuous buying or selling during the life of the signal. For example, a BUY signal will probably (but not necessarily) return the best results if action is taken soon after the signal is generated. Additional opportunities for buying may be found as price zigzags higher, but the trader must look for optimum entry points. Conversely, exit points to preserve gains (or minimize losses) may be evident before the model mechanically closes the signal.
The DecisionPoint LIVE Shared ChartList has launched! Click on the link and you'll find webinar and blog chart spotlights. Be sure and bookmark it!
Technical Analysis is a windsock, not a crystal ball.
Happy Charting!
- Carl
