In our Conclusions section of the Weekly Wrap last week, I expressed my heightened level of caution due to the negative condition of our indicators. On Monday a nice rally to new, all-time highs gave me cause to doubt my assessment, but the rally stalled on Tuesday, and the bottom fell out on Wednesday. But never mind, the market bounced off Thursday's low, and about half of the loss was recovered by Friday's close. Will Thursday's low be retested, or has another up leg begun? Let's look at the technicals and see if they can give us a clue as to what may happen next.
The DecisionPoint Weekly Wrap presents an end-of-week assessment of the trend and condition of the stock market (S&P 500), the U.S. Dollar, Gold, Crude Oil, and Bonds.
STOCKS
IT Trend Model: BUY as of 11/15/2016
LT Trend Model: BUY as of 4/1/2016
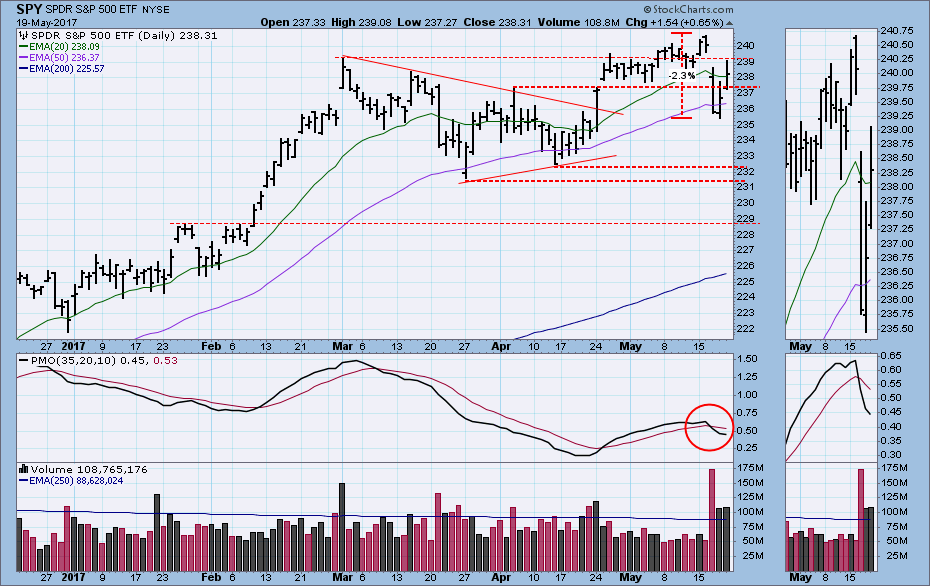
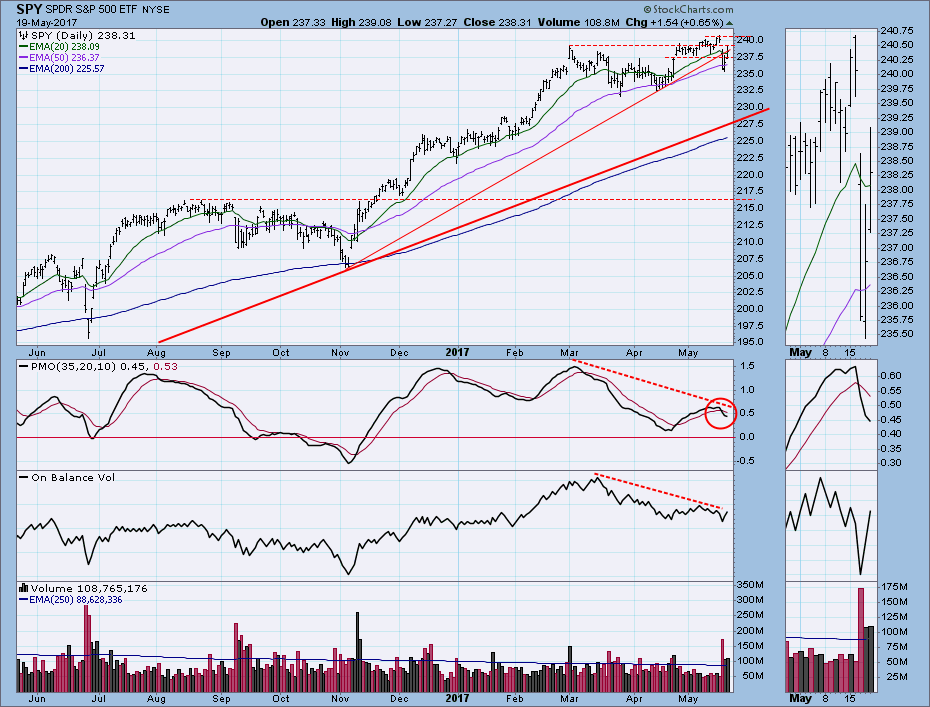
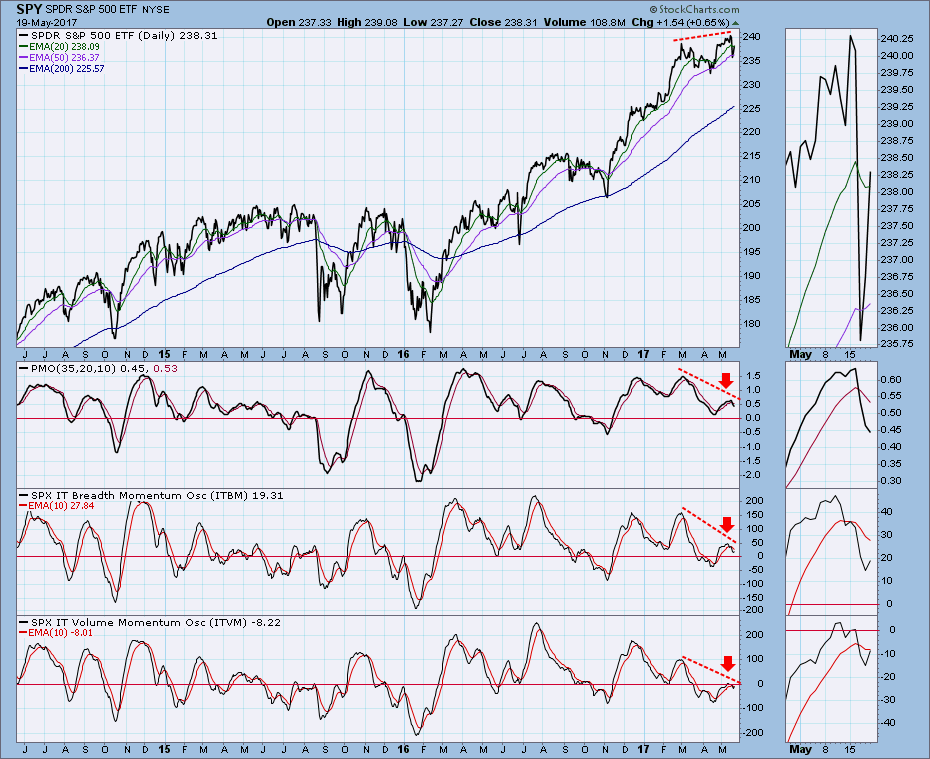
First, I must point out that the total decline from Tuesday's all-time high was a mere -2.3%. Granted, Wednesday was somewhat dramatic, but it hardly justified all the headless chickens and spontaneously combusting hair. Put in the perspective of the one-year daily chart below, we can see that price is still substantially above the longer-term rising trend line. (The origin of that trend line is made clear on the weekly chart.) My expectation is that price will move back to that line eventually, but I don't have a road map. The steeper trend line drawn from the November price low was violated this week, so the line is no longer relevant. PMO and OBV negative divergences still exist. Friday was options expiration day, so do not consider Friday's high volume to be a demonstration of confidence in the rally.
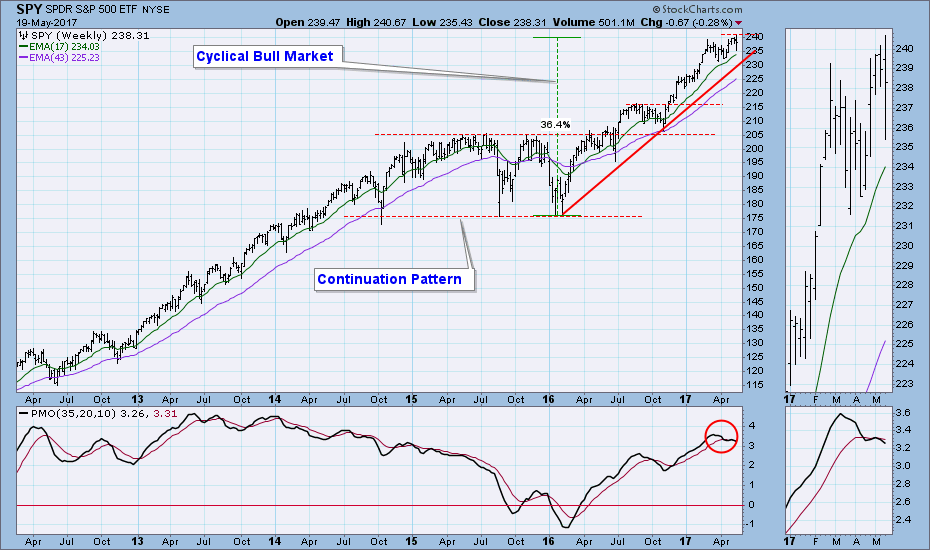
The weekly chart shows that price is gradually moving back toward the primary rising trend line drawn from the 2016 low. A strong negative is that the weekly PMO (Price Momentum Oscillator) is declining below its signal line.
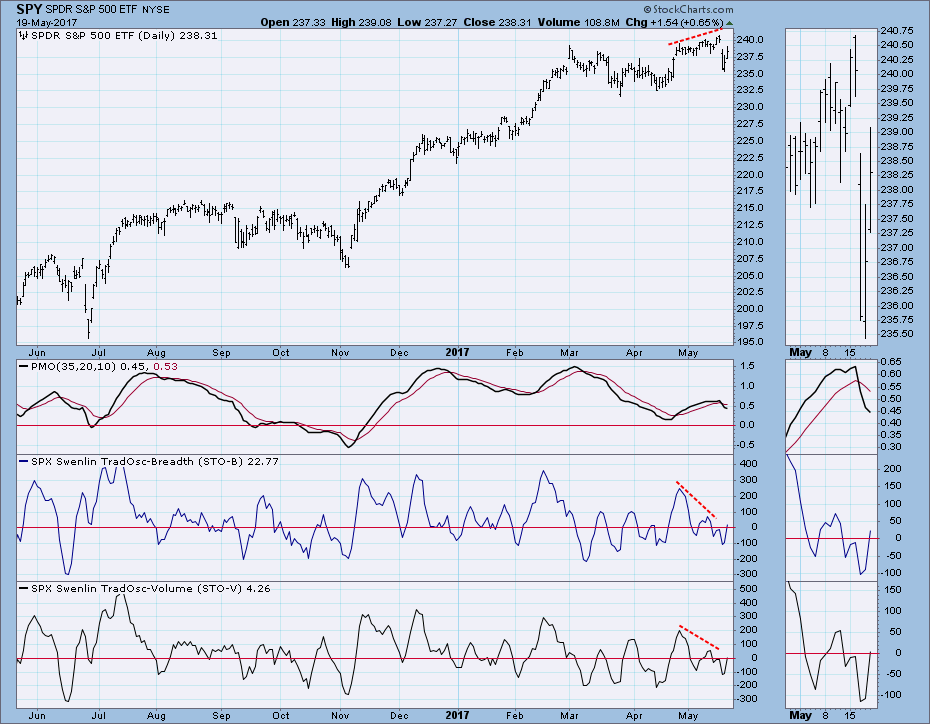
Short-Term Market Indicators: The negative divergences shown are actually no longer operative because their warning has been fulfilled by this week's decline. Now those indicators are rising from oversold levels, and will accommodate higher prices in this time frame. We should note, however, that quick reversals have been commonplace as of late.
Intermediate-Term Market Indicators: Like the short-term indicators, these indicators have experienced quick reversals -- I count six on the ITBM in the last two weeks. Assuming that prices continue higher, it will be a while before they become overbought. The negative divergences in this time frame are still operative, even though the ITBM and ITVM are rising.
Conclusion: We are in an intermediate-term and long-term bull market, and I don't think we are seeing a major top forming here. Someday that top will come, but, until I see serious technical damage being done, I am going to assume that the bull will prevail. I will be thinking the same way when the top actually arrives, and I will have to adjust my outlook as the market rolls over and proves me wrong. That being said, I am not convinced that the current correction is over. I don't rule that out, but I think that a little more work needs to be done on the downside.
DOLLAR
IT Trend Model: NEUTRAL as of 3/21/2016
LT Trend Model: BUY as of 10/17/2016
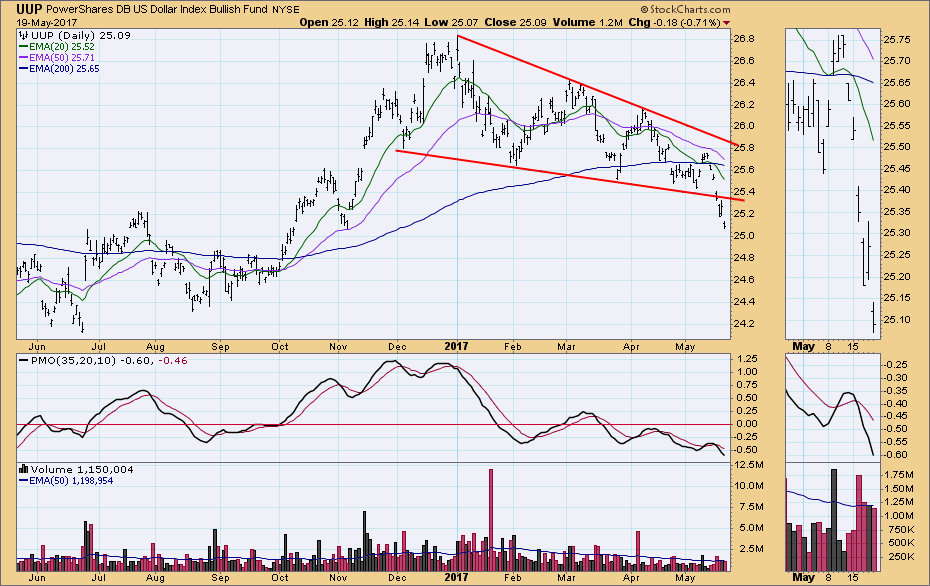
Falling wedges are bullish because they normally resolve to the upside, but not always. I have been feeling that the UUP falling wedge was going to be one of the "not always" outcomes. While the market was making all-time highs, UUP was breaking down rather dramatically, and a 50/200EMA downside crossover (LT SELL signal) could occur next week.
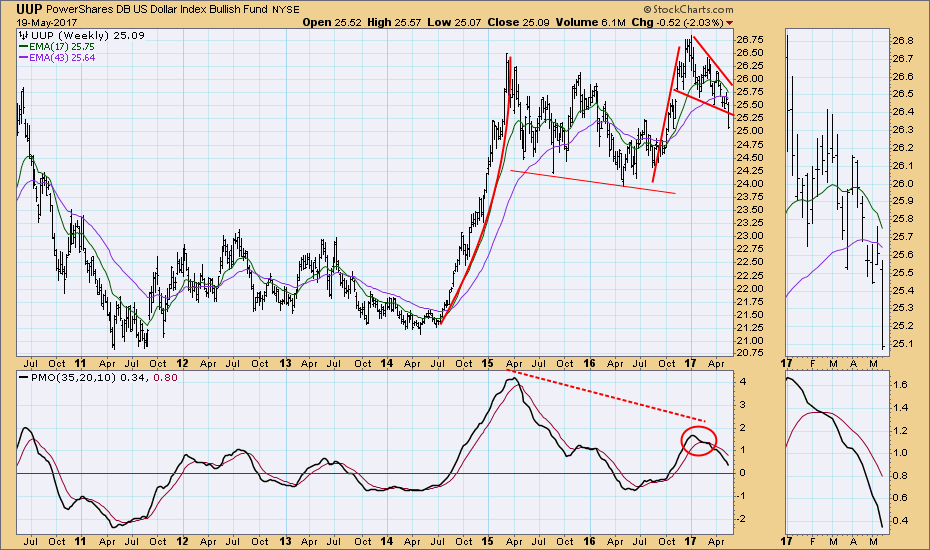
On the weekly chart the same falling wedge (pennant) breakdown is visible, and the negative weekly PMO certainly gave us an early warning.
GOLD
IT Trend Model: NEUTRAL as of 5/11/2017
LT Trend Model: BUY as of 4/12/2017
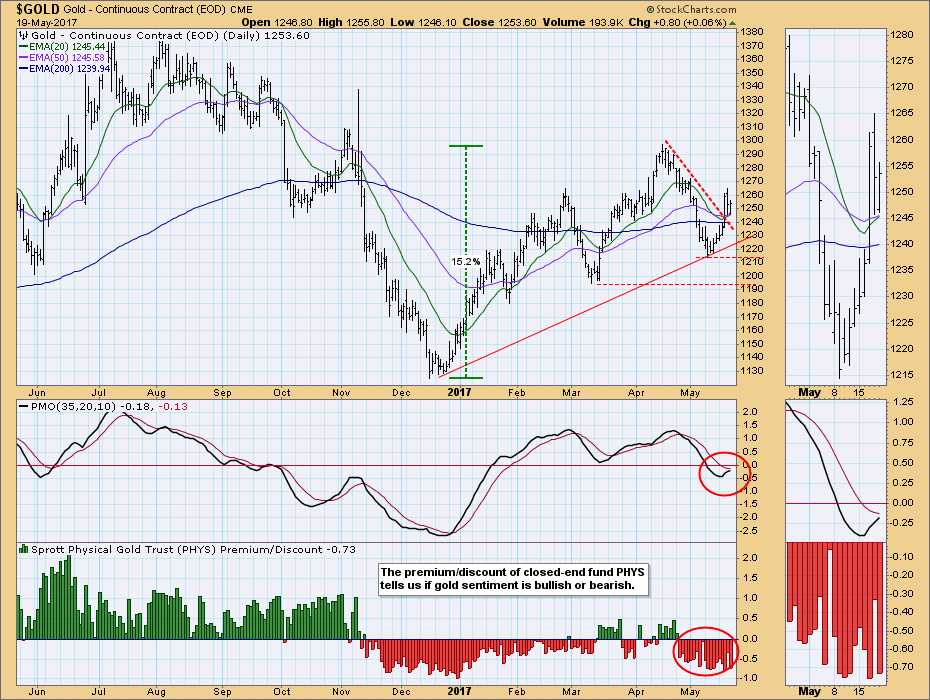
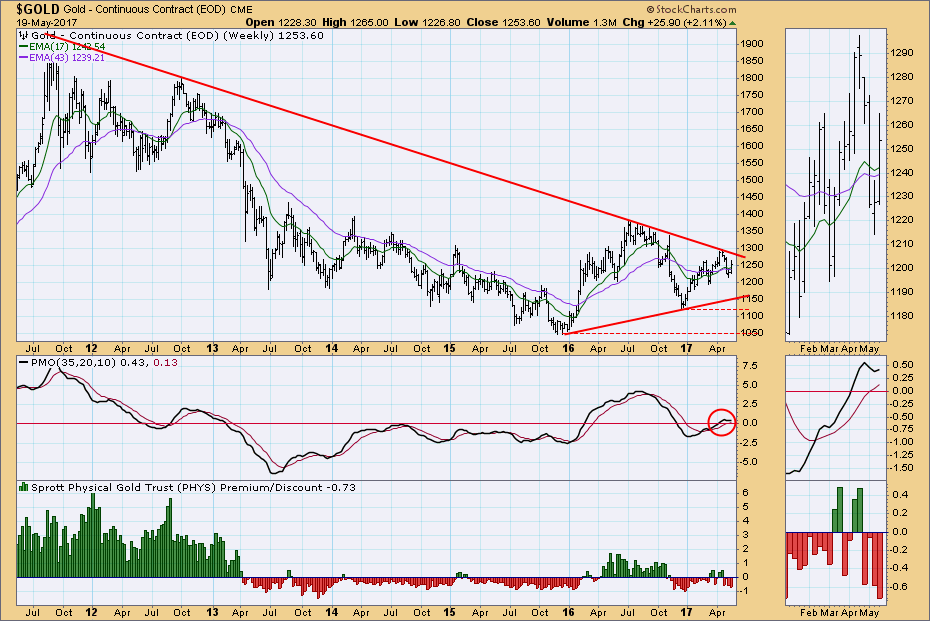
Gold's reaction to stocks pulling back was to extend the in-progress rally. The PMO is rising, but it looks like it wants to top. Gold sentiment never got bullish, in spite of the one-day pop, and I'm getting a neutral message from the chart. Note that all the EMAs are close together, and next week a new IT Trend Model BUY signal will be generated unless price drops below the 20EMA and 50EMA. Could happen, but it is not likely to clear the picture much.
The weekly chart shows gold still in a triangle formation, and the weekly PMO turned up this week.
CRUDE OIL (USO)
IT Trend Model: NEUTRAL as of 3/8/2017
LT Trend Model: SELL as of 3/9/2017
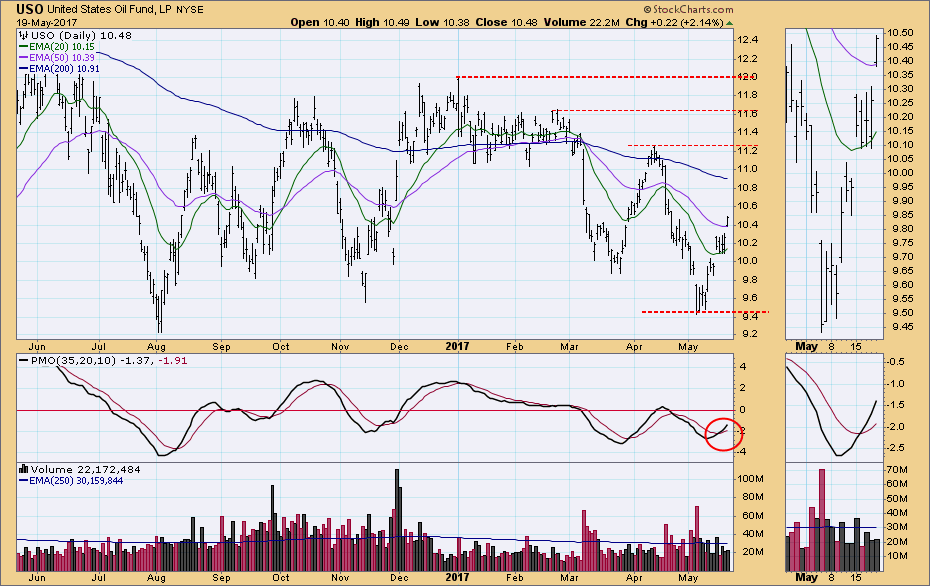
USO began a rally last week, and it continued this week. A PMO crossover BUY signal materialized, and my expectation is for price to move up to the top of the trading range, to about 12.00.
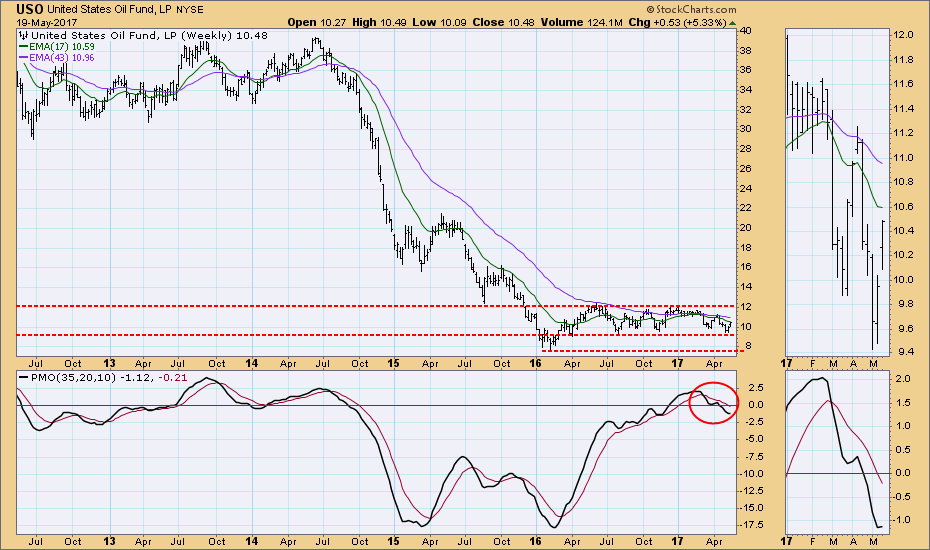
The weekly PMO for USO bottomed this week, another positive sign supporting a continuation of the rally.
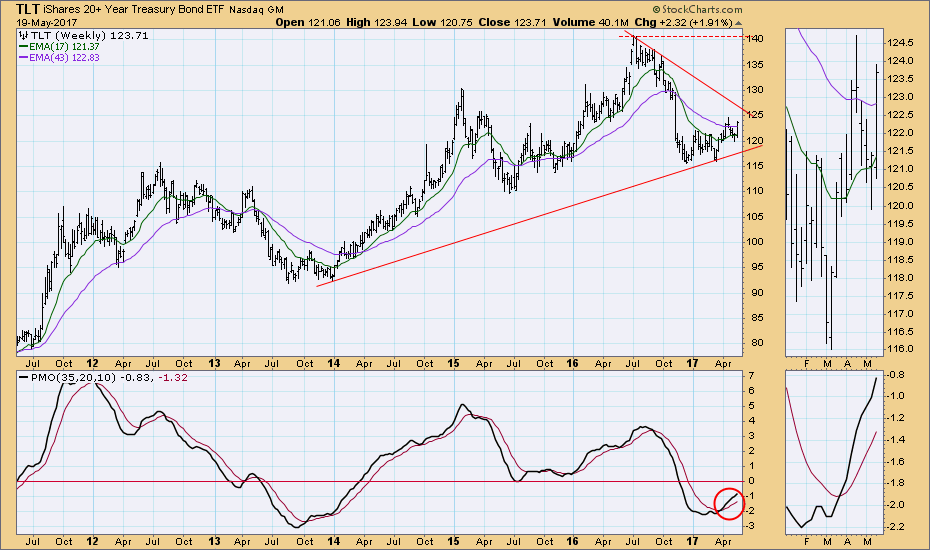
BONDS (TLT)
IT Trend Model: BUY as of 3/31/2017
LT Trend Model: SELL as of 11/17/2016
On Wednesday bonds (TLT) had a strong up move as falling stocks prompted a flight to safety. My annotations emphasize the trading range, but I can also see a bullish saucer with handle. The PMO is rising above its signal line.
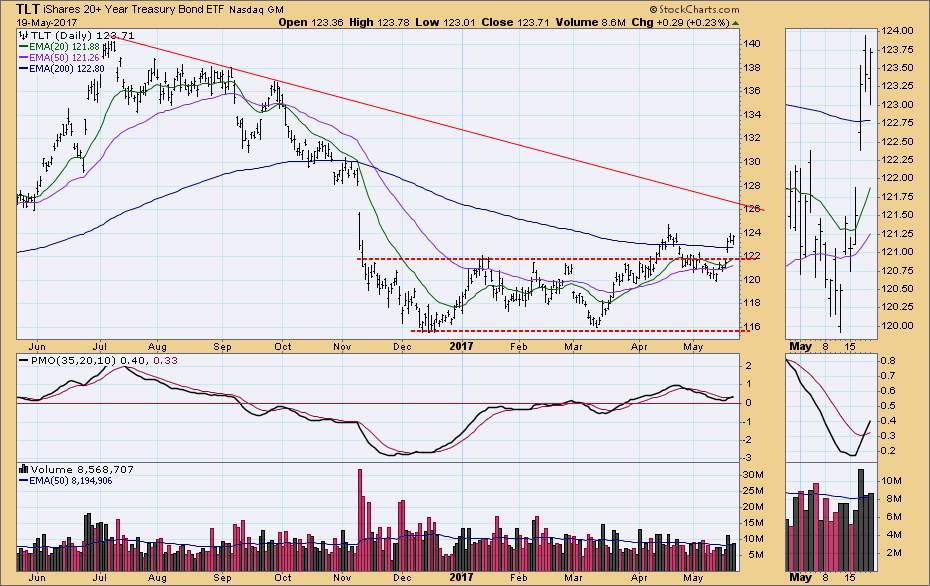
The TLT weekly chart is positive with the weekly PMO rising above its signal line. Currently, price is contained by a triangle formation.
**Don't miss the DecisionPoint Alert Daily Commentary! Go to the "Notify Me" box toward the end of this blog page to be notified as soon as it is published at the end of the market day.**
Technical Analysis is a windsock, not a crystal ball.
Happy Charting!
- Carl
NOTE: The signal status reported herein is based upon mechanical trading model signals, specifically, the DecisionPoint Trend Model. They define the implied bias of the price index based upon moving average relationships, but they do not necessarily call for a specific action. They are information flags that should prompt chart review. Further, they do not call for continuous buying or selling during the life of the signal. For example, a BUY signal will probably (but not necessarily) return the best results if action is taken soon after the signal is generated. Additional opportunities for buying may be found as price zigzags higher, but the trader must look for optimum entry points. Conversely, exit points to preserve gains (or minimize losses) may be evident before the model mechanically closes the signal.
Helpful DecisionPoint Links:
DecisionPoint Shared ChartList and DecisionPoint Chart Gallery
Price Momentum Oscillator (PMO)
Swenlin Trading Oscillators (STO-B and STO-V)
