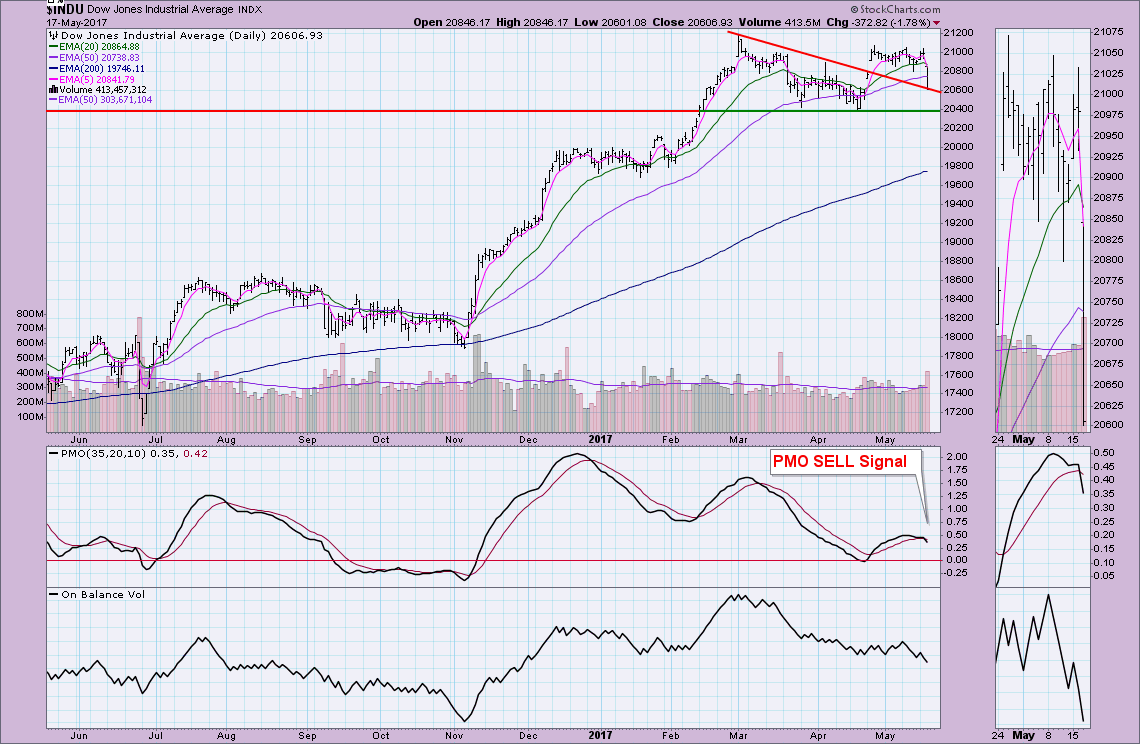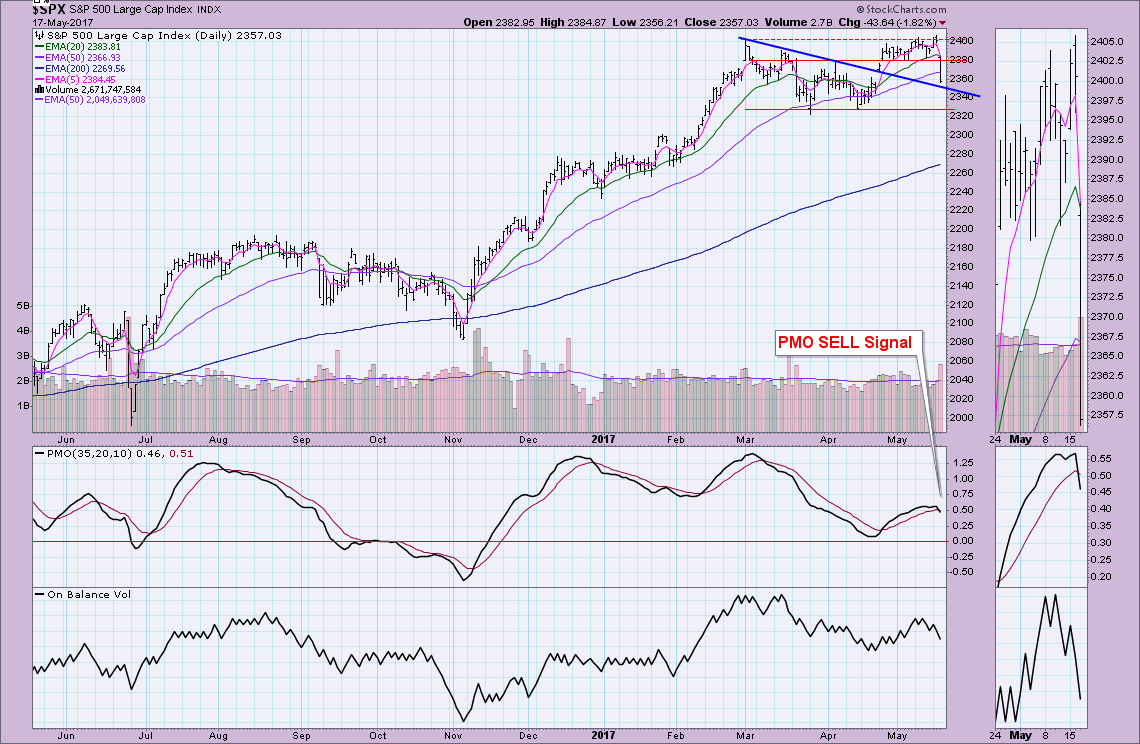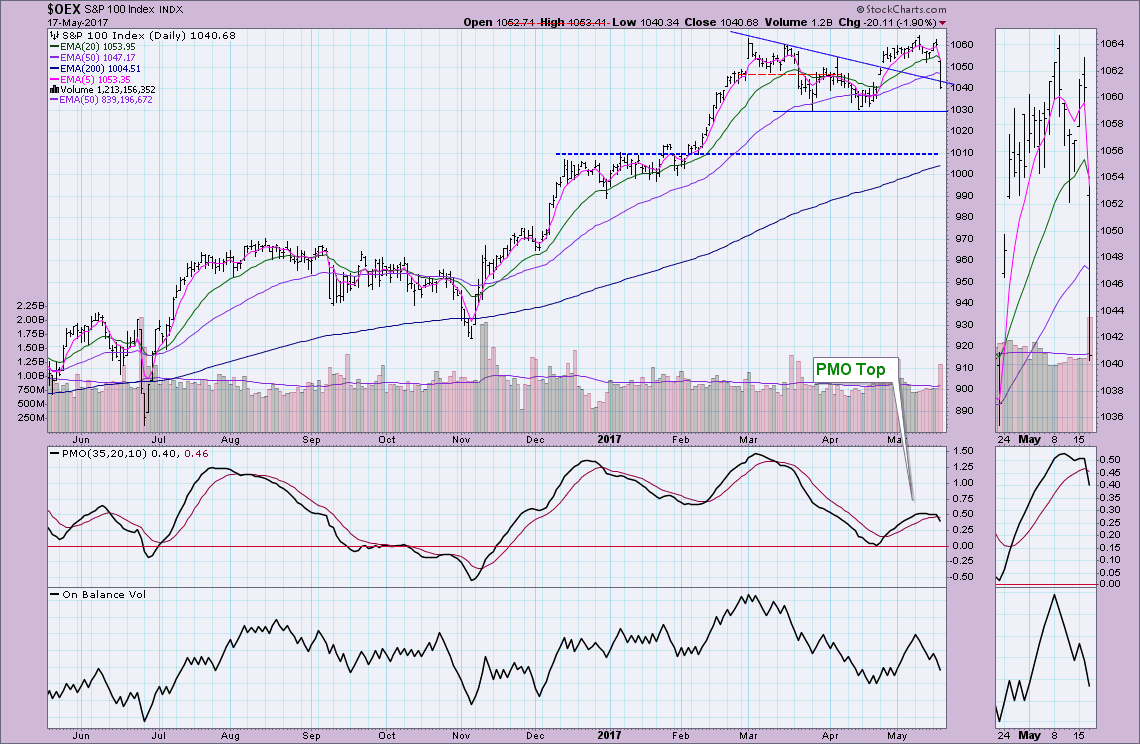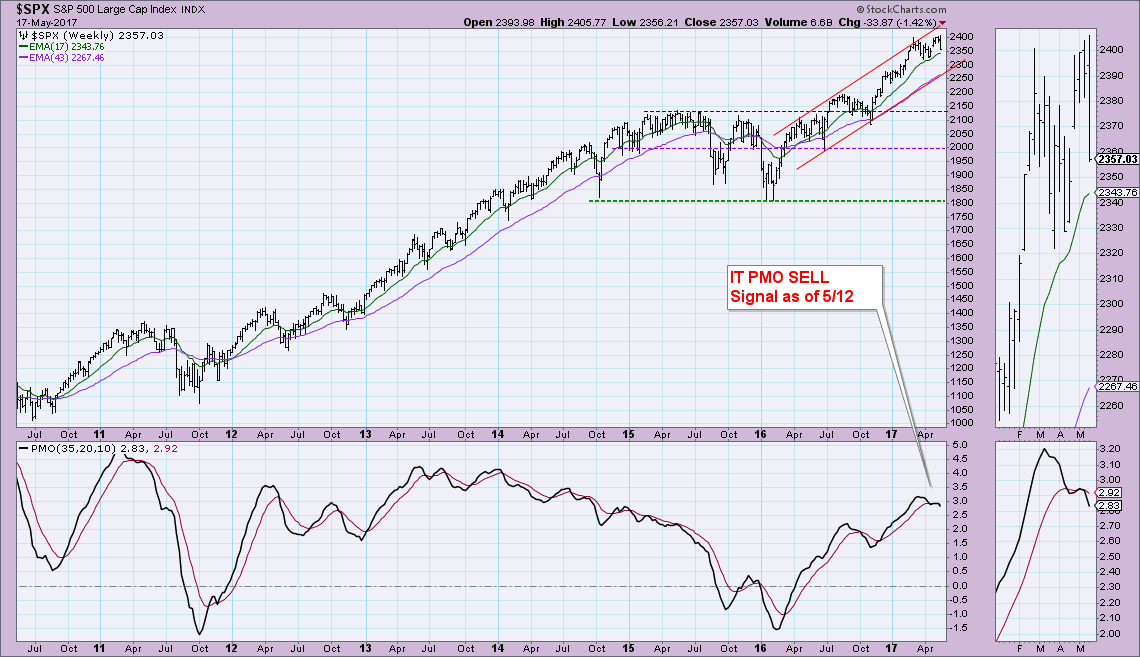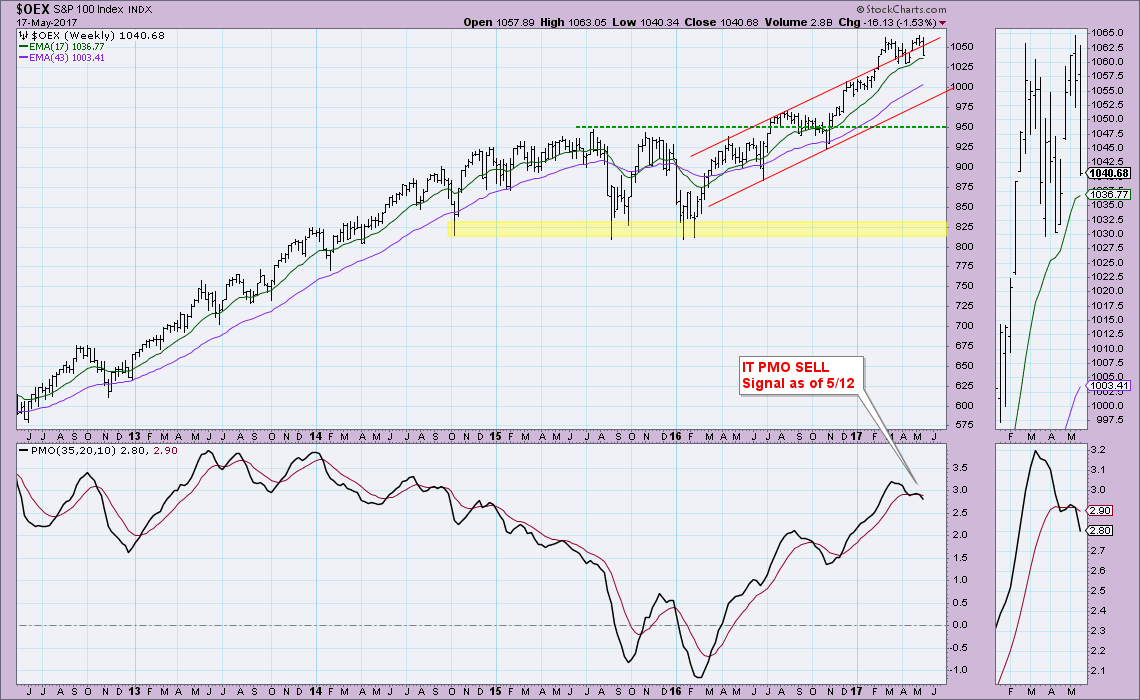
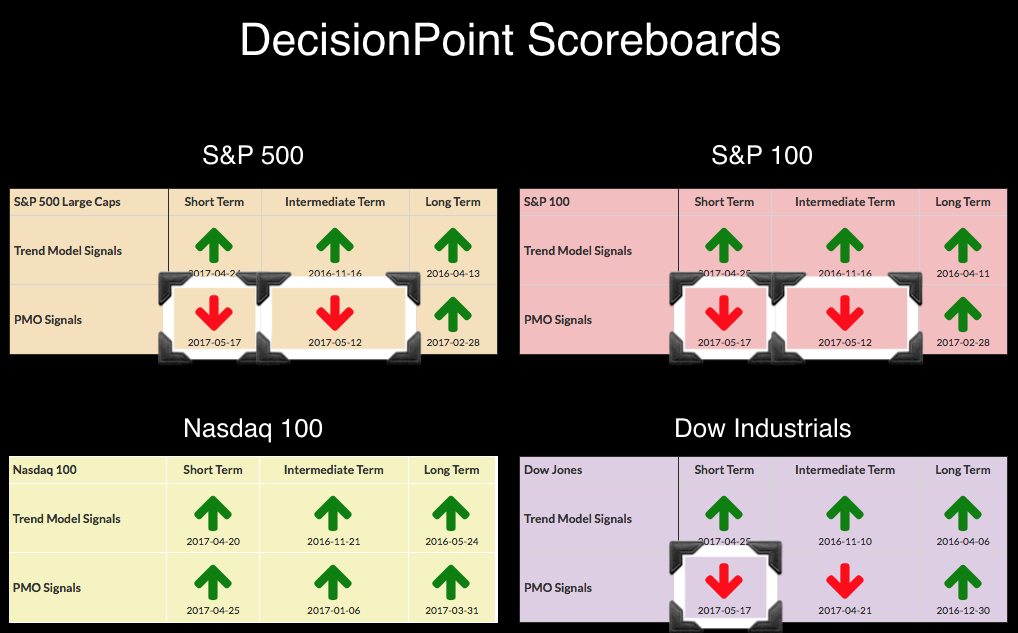
 You'll likely notice the significant changes to the DP Scoreboards (which you can now find on your member homepage in the drop down in the "Market Movers" box!). A clear shift in momentum is taking place. Yesterday the short-term Price Momentum Oscillators (PMOs) were all rising on the Dow, SPX and OEX. Today they were yanked down so far that it triggered PMO crossover SELL signals. The weekly charts last Friday reflected the two new IT PMO SELL signals on the SPX and OEX.
For the Dow and SPX below, there is still the possibility prices could hold this level as support along the declining tops trend lines.
However, for the OEX that support has already been broken. Price could travel as low as 1030 before this short-term correction is over.
We did get some warning from the weekly charts (and I deeply apologize right now for the late notice as I missed these charts Friday) which both triggered IT PMO SELL signals.
Conclusion: I'll be watching price action closely to see if this is an initiation to lower prices. I'll be going over the indicator charts in tomorrow's blog.
Helpful DecisionPoint Links:
DecisionPoint Shared ChartList and DecisionPoint Chart Gallery
Price Momentum Oscillator (PMO)
Swenlin Trading Oscillators (STO-B and STO-V)
Technical Analysis is a windsock, not a crystal ball.
Happy Charting!
- Erin

