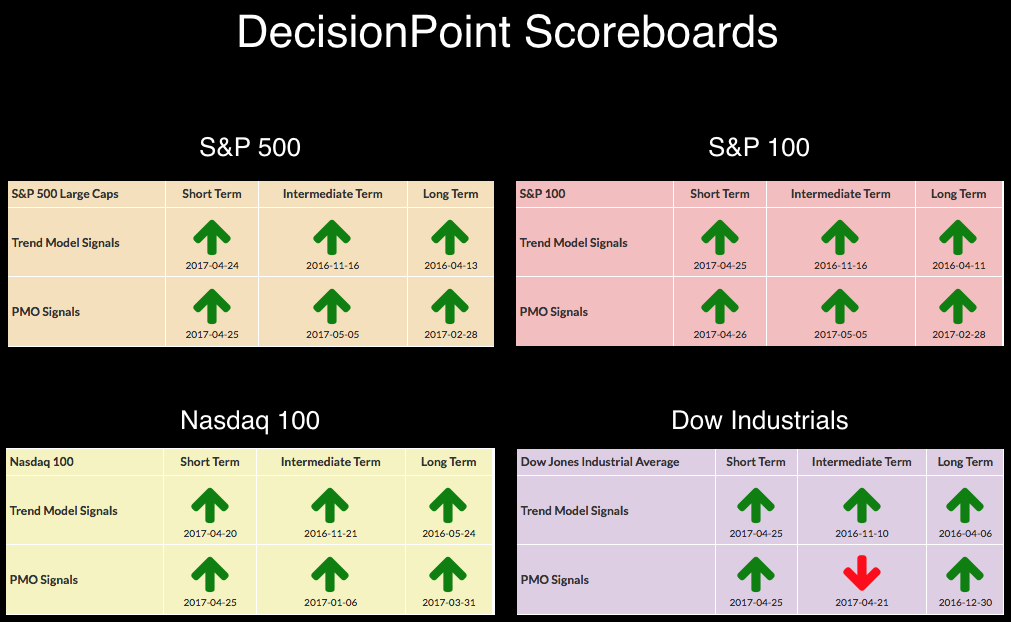
 No new changes to the DP Scoreboards to report...except that you can now find the DP Scoreboards on your member homepage! I'll be writing about how to quickly access it in tomorrow's blog. While everything remains green on most of the boards, I did note when reviewing the charts in the DP Shared ChartList that ST PMOs are topping or have topped. The weekly (IT) PMOs may not be able to hold onto the current BUY signals. I'll update you on any new changes that arrive tomorrow on any of the weekly charts.
The purpose of the DecisionPoint Alert Daily Update is to quickly review the day's action, internal condition, and Trend Model status of the broad market (S&P 500), the nine SPDR Sectors, the U.S. Dollar, Gold, Crude Oil, and Bonds. To ensure that using this daily reference will be quick and painless, we are as brief as possible, and sometimes we let a chart speak for itself.
SIGNALS: Here we include charts of any important signal changes triggered today by our Intermediate-Term Trend Model.
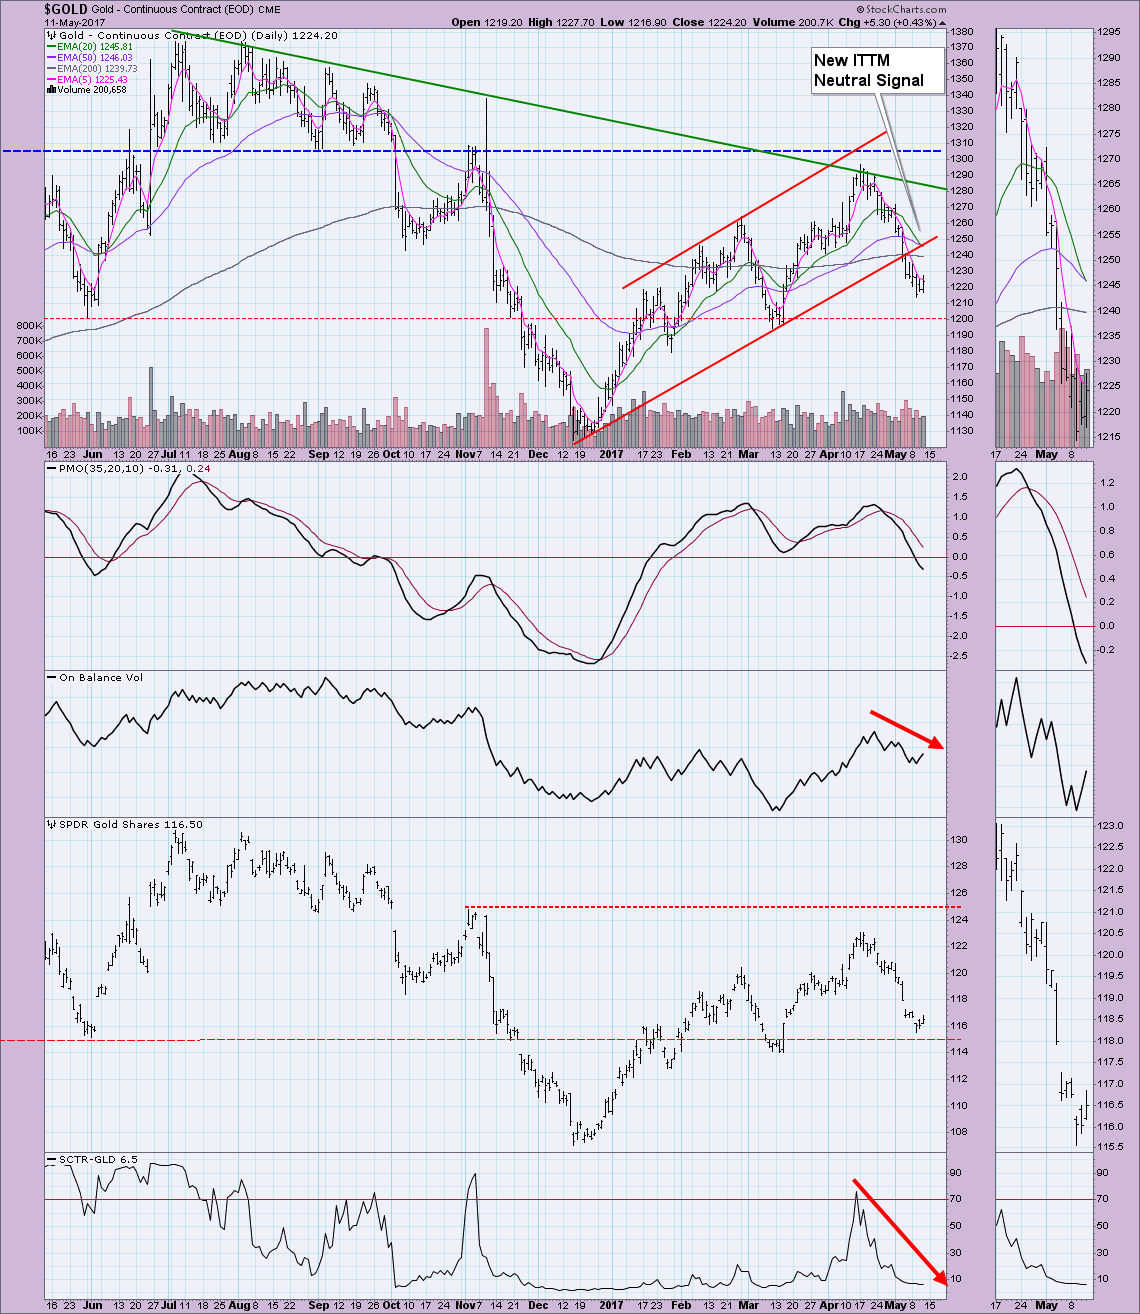
NEW ITTM Neutral Signal for GOLD
I'll review this in the section on Gold further down.
NOTE: Mechanical trading model signals define the implied bias of the price index based upon moving average relationships, but they do not necessarily call for a specific action. They are information flags that should prompt chart review. Further, they do not call for continuous buying or selling during the life of the signal. For example, a BUY signal will probably return the best results if action is taken soon after the signal is generated. Additional opportunities for buying may be found as price zigzags higher, but the trader must look for optimum entry points. Conversely, exit points to preserve gains (or minimize losses) may be evident before the model mechanically closes the signal.
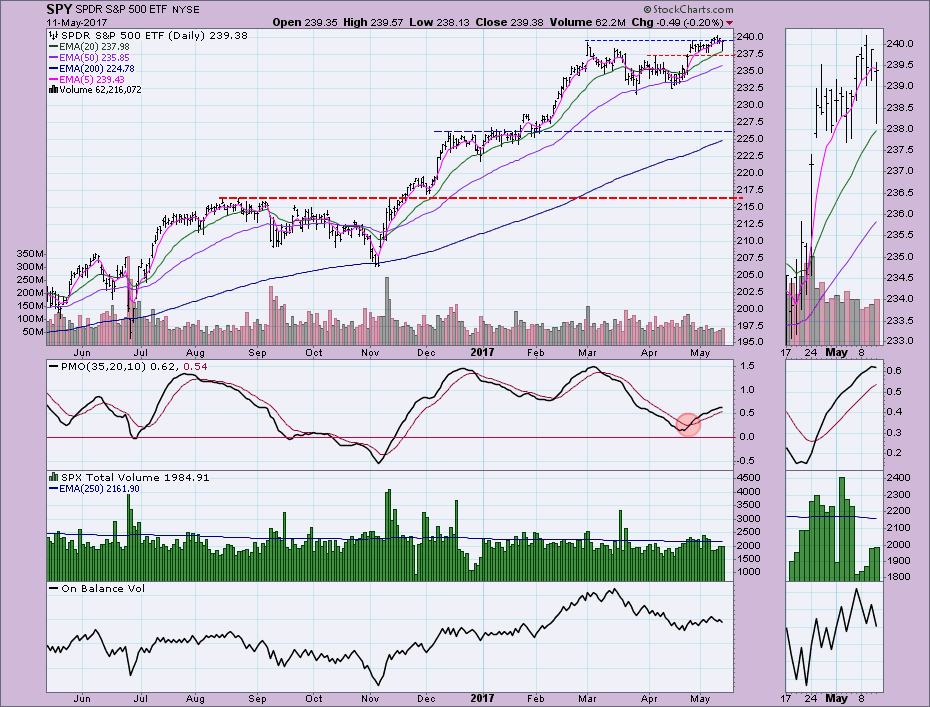
STOCKS: Based upon a 11/15/2016 Intermediate-Term Trend Model BUY signal, our current intermediate-term market posture for the S&P 500 (SPY) is bullish. The Long-Term Trend Model, which informs our long-term outlook, is on a BUY signal as of 4/1/2016 so our long-term posture is bullish.
The markets basically crashed this morning, but bulls were able to take the reins and clear most of the losses. So while price dropped below support, it did manage to climb above it by the end of the day and hold it.
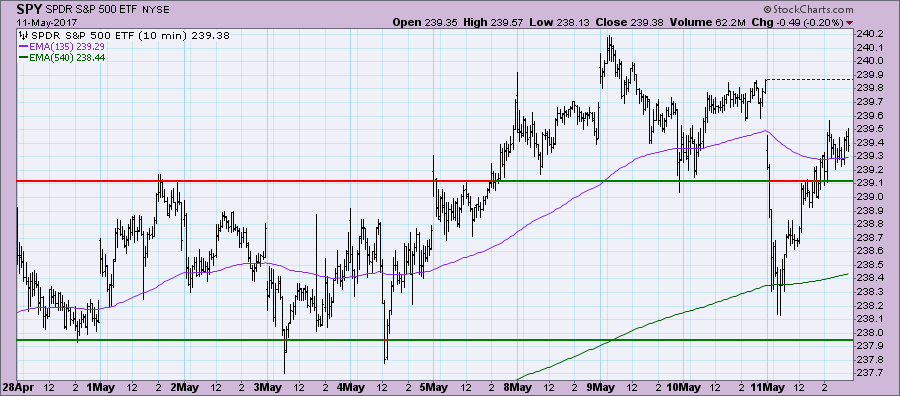
Even had prices closed on lows today, it would still have kept price above gap support. I'm concerned that we will see the gap closed, but I think support will still be held at the early April top around $237.50 even if we do see it close. The PMO and OBV are topping which I don't like.
Ultra-Short-Term Indicators: The VIX finally pulled back from record lows but remains safely above its moving average. If we see it move below its average or get close to the lower band, then we should expect another pop lower. I do think it is positive that we saw the push higher at the end of the day.
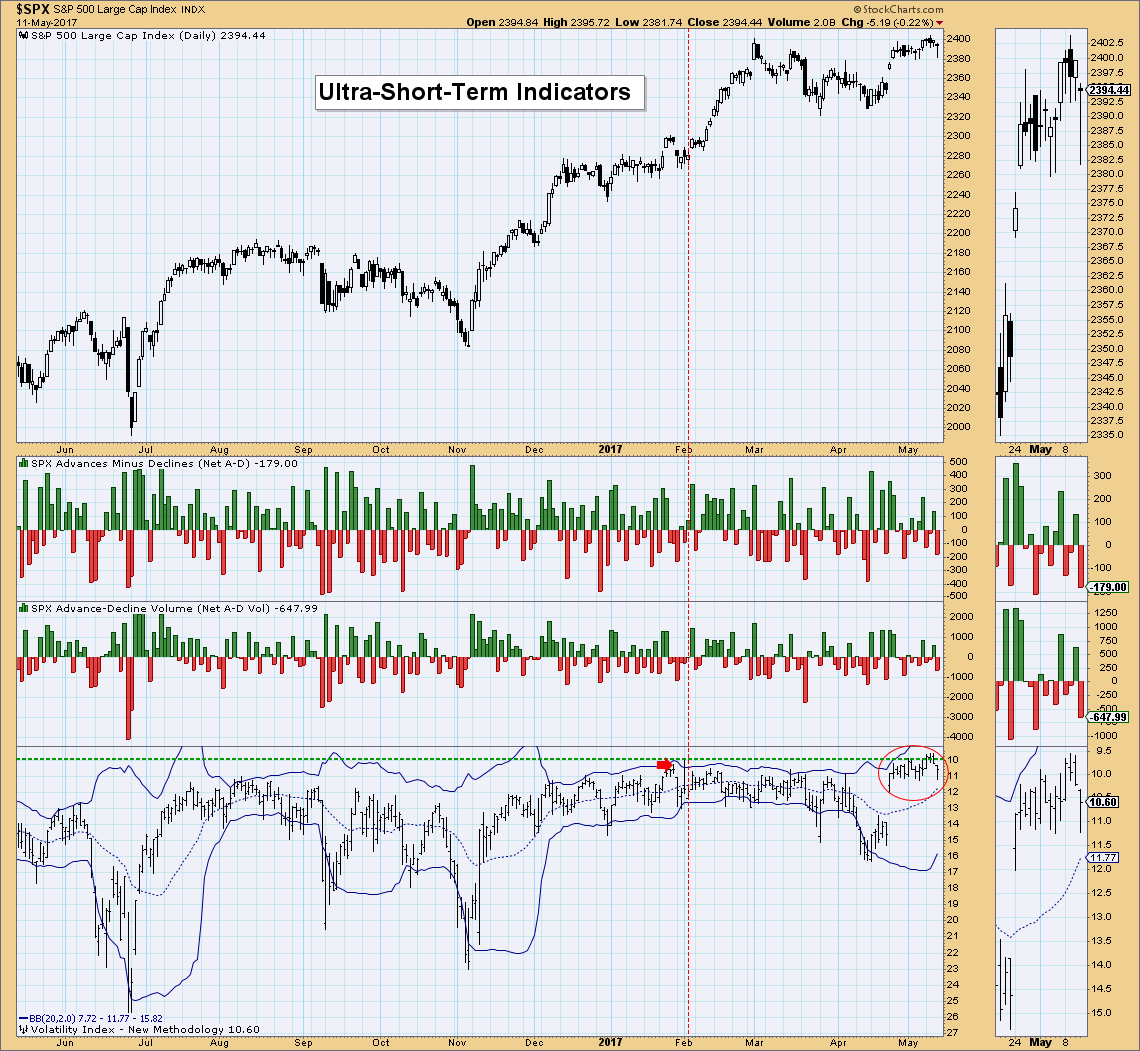
Short-Term Indicators: The STO-V is still rising, though decelerating and the STO-B has topped. I don't like this configuration but until I see the STO-V drop or see these readings drop below zero, I'm not looking for a serious decline.
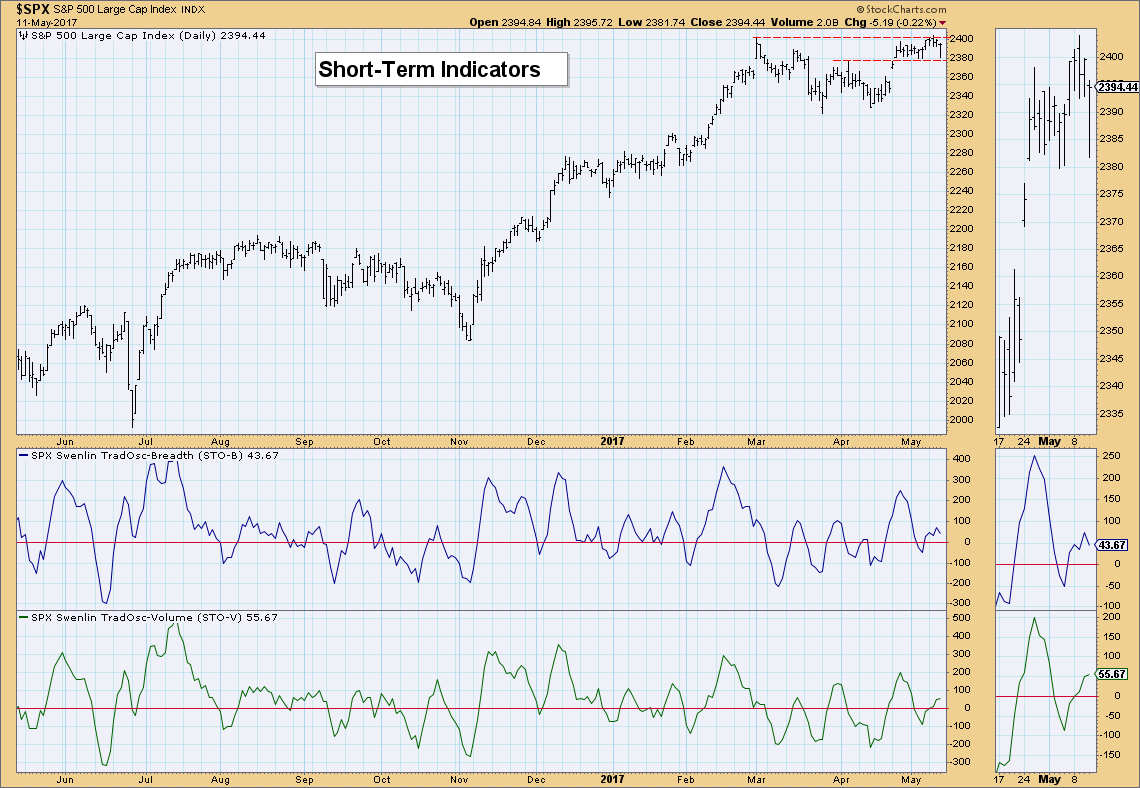
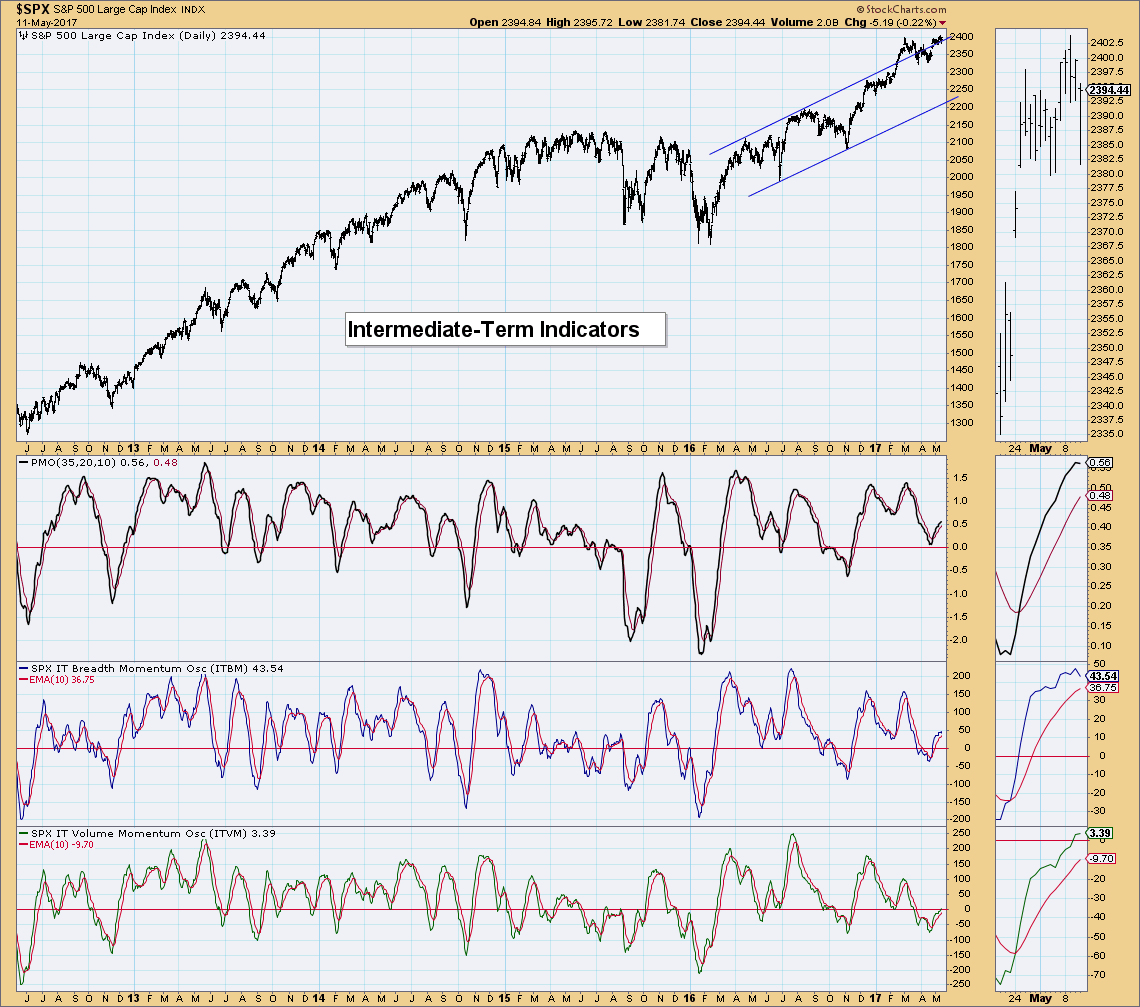
Intermediate-Term Indicators: We're seeing the same divergence between the ITBM and ITVM. As I noted in my previous DP Alert, I won't worry about these either until we see some negative crossovers below their signal lines.
Conclusion: Indicators have definitely softened but I don't see them as 'bearish' yet, more neutral. Likely we are in for more sideways consolidation within the $237.50 and $240 zone.
**Don't miss the DecisionPoint Alert Daily Commentary! Click on "Email Updates" at the end of this blog page to be notified as soon as it's published at the end of the market day.**
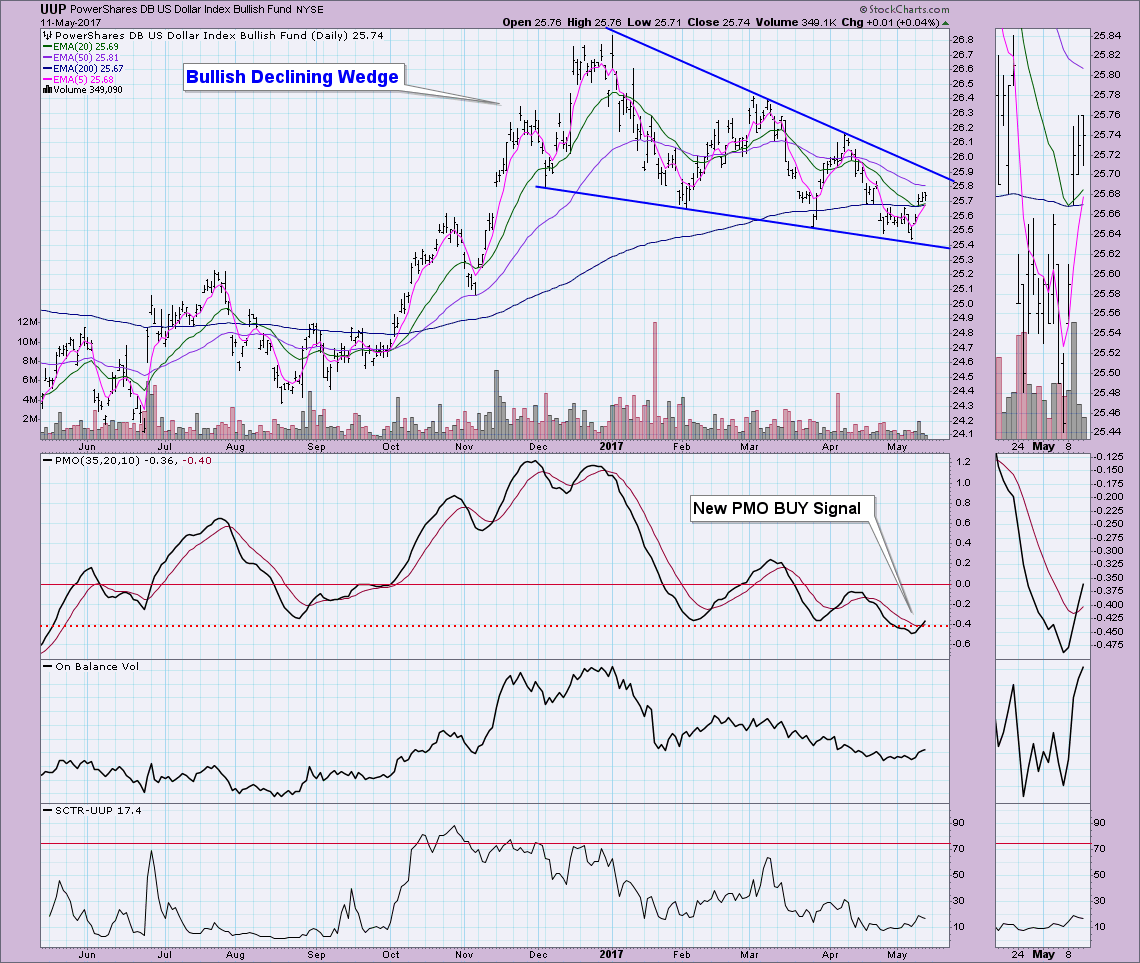
DOLLAR: As of 3/21/2017 the US Dollar Index ETF (UUP) is on an Intermediate-Term Trend Model Neutral signal. The Long-Term Trend Model, which informs our long-term outlook, is on a BUY signal as of 10/17/2016, so our long-term posture is bullish.
The PMO BUY signal on the Dollar is great. Price really needs to execute this bullish pattern with a breakout or the pattern will bust in my opinion. When price gets too close the apex, the validity of the pattern comes into question. The OBV is now rising and the SCTR, while very low, is showing a few signs of life.
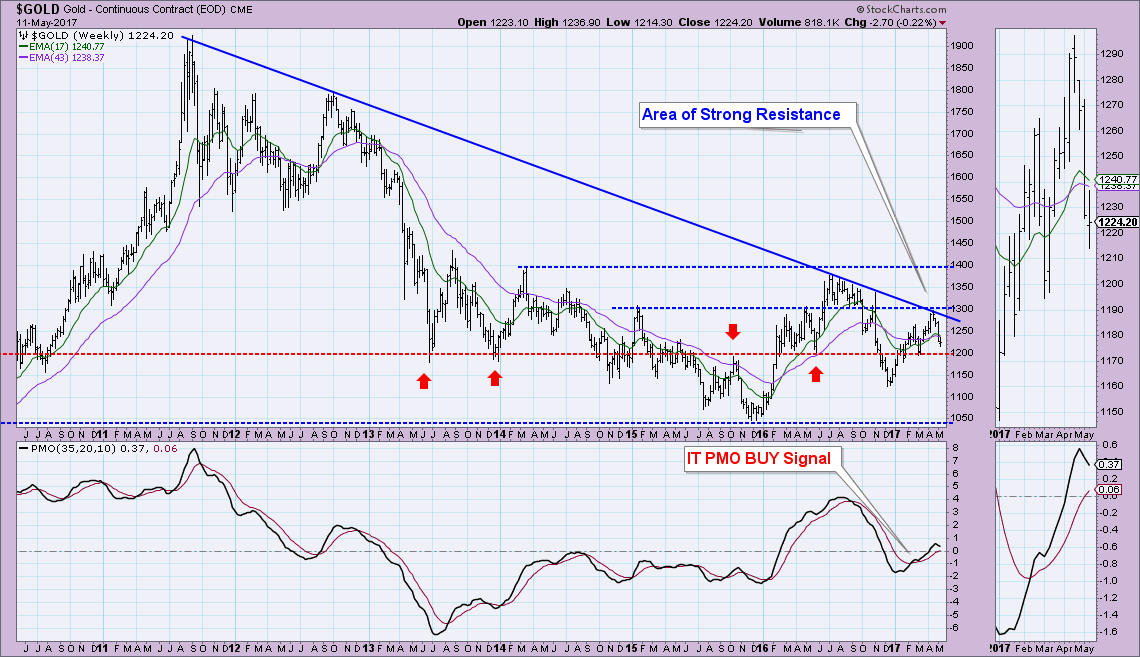
GOLD: As of 5/9/2017 Gold is on an Intermediate-Term Trend Model Neutral signal. The Long-Term Trend Model, which informs our long-term outlook, is on a BUY signal as of 4/11/2017, so our long-term posture is bullish.
Indicators don't support it, but I think that 1200 should hold as support for Gold. Granted we just got a new IT Trend Model Neutral signal and the 50-EMA is making a run toward the 200-EMA for a LT Trend Model SELL signal. But the weekly chart really suggests that the 1200 level should hold based solely on the many "touches" we have seen at that price. I don't like the indicators at all, so we should be prepared for a drop below $1200.
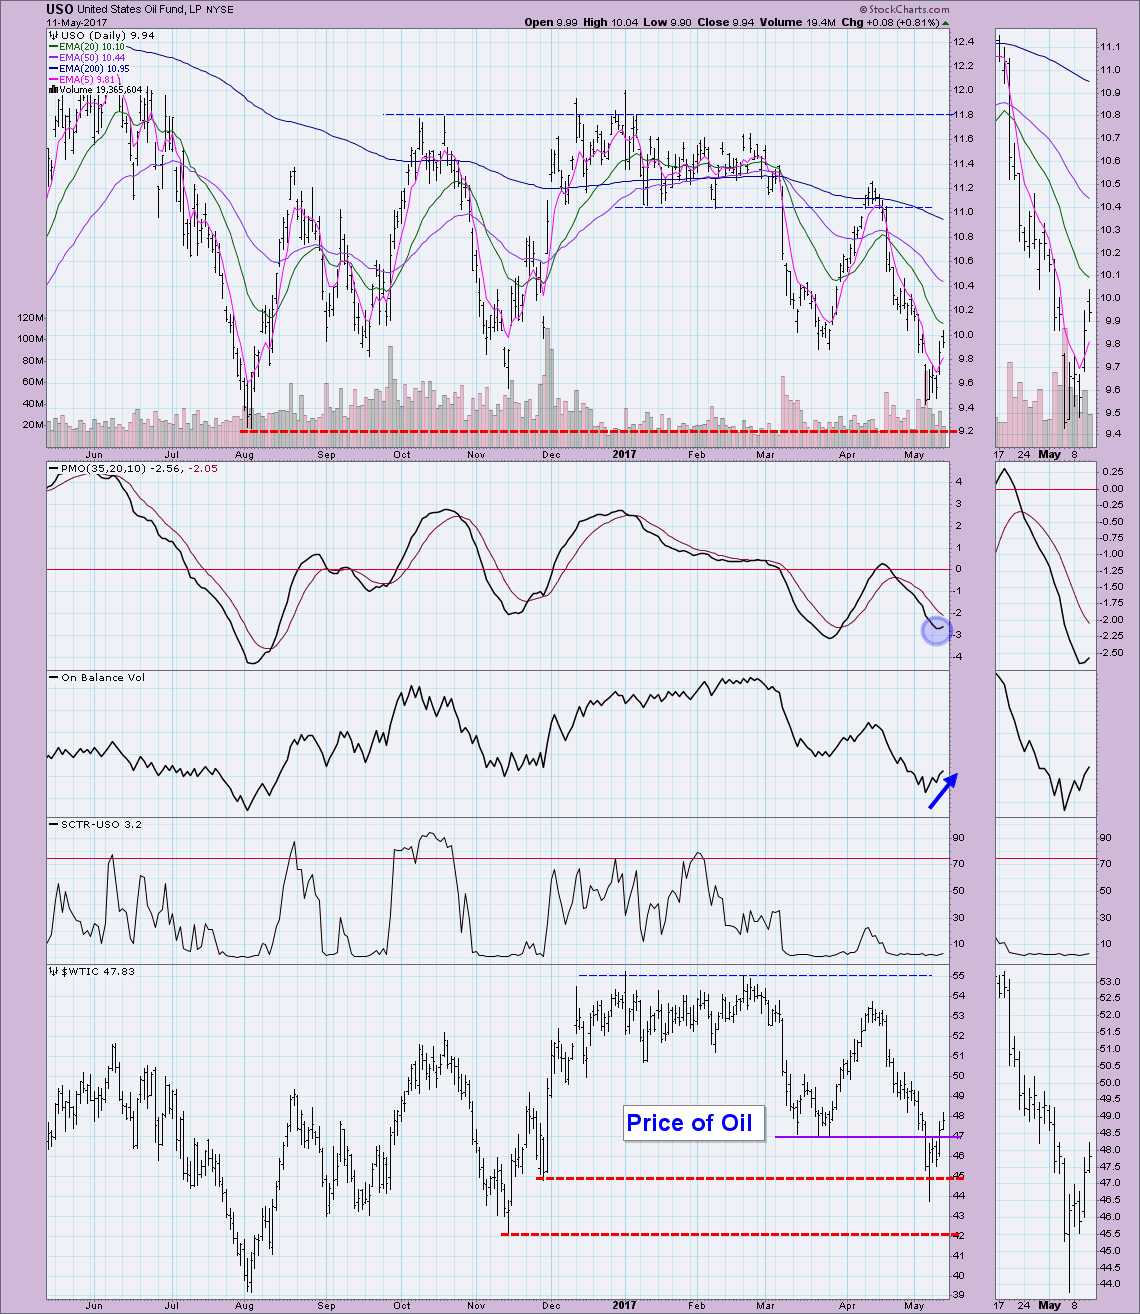
CRUDE OIL (USO): As of 3/8/2017 United States Oil Fund (USO) is on an Intermediate-Term Trend Model Neutral signal. The Long-Term Trend Model, which informs our long-term outlook, is on a SELL signal as of 3/9/2017, so our long-term posture is bearish.
Oil prices finally jumped back above $47/barrel which tells me this is likely a good bottom for USO. Indicators are positive except for the basement line SCTR.
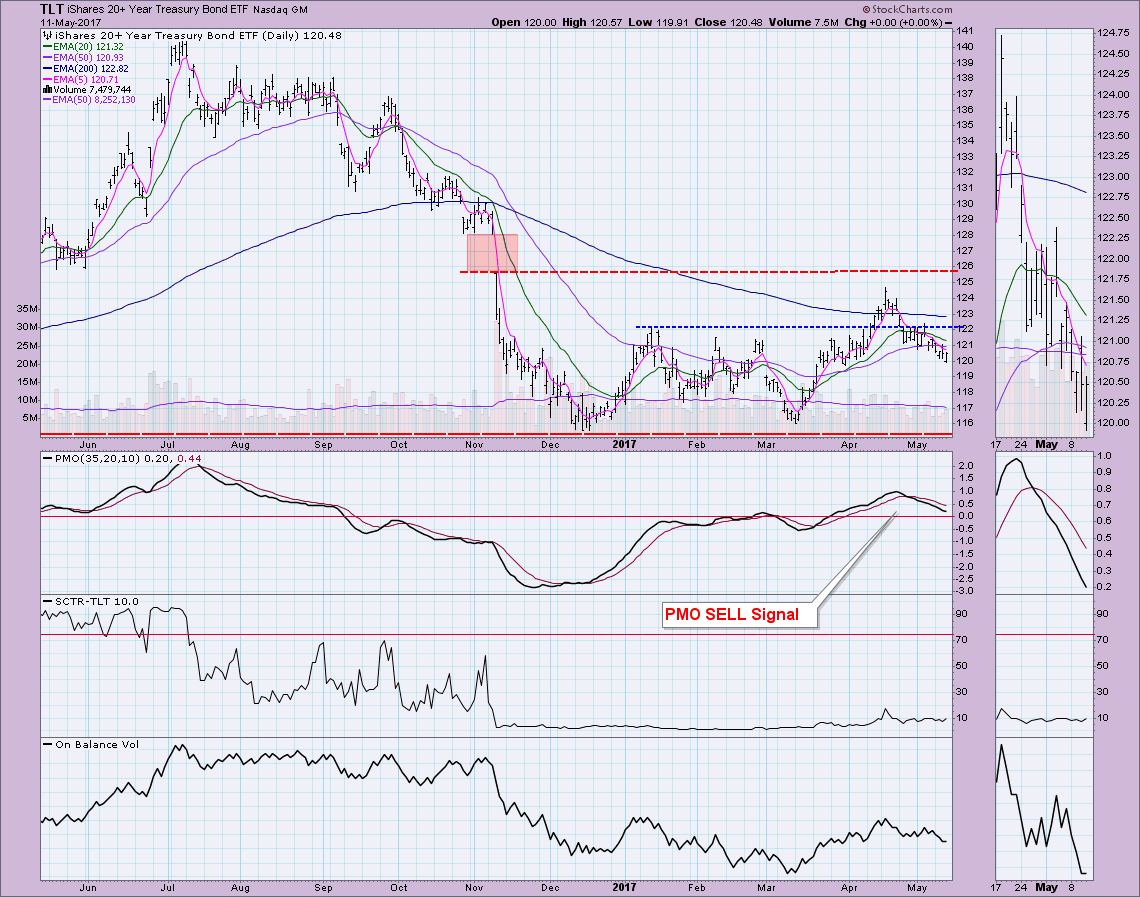
BONDS (TLT): As of 3/31/2017 The 20+ Year T-Bonds ETF (TLT) is on an Intermediate-Term Trend Model BUY signal. The Long-Term Trend Model, which informs our long-term outlook, is on a SELL signal as of 11/17/2016, so our long-term posture is bearish.
TLT remains in a declining trend. You could make a case for a head and shoulders forming, but honestly, the target price would be around $116 anyway which is showing at the strongest area of support. Optimistically we could see a rebound at the $118 level but I'm not seeing any positive divergences that support that at this point.
Helpful DecisionPoint Links:
DecisionPoint Shared ChartList and DecisionPoint Chart Gallery
Price Momentum Oscillator (PMO)
Swenlin Trading Oscillators (STO-B and STO-V)
Technical Analysis is a windsock, not a crystal ball.
Happy Charting!
- Erin
