When big market moves in the $SPX or other major indexes happen, there is usually a big move in the currencies. Today, studying the non-Euro currencies reveals an interesting dilemma.
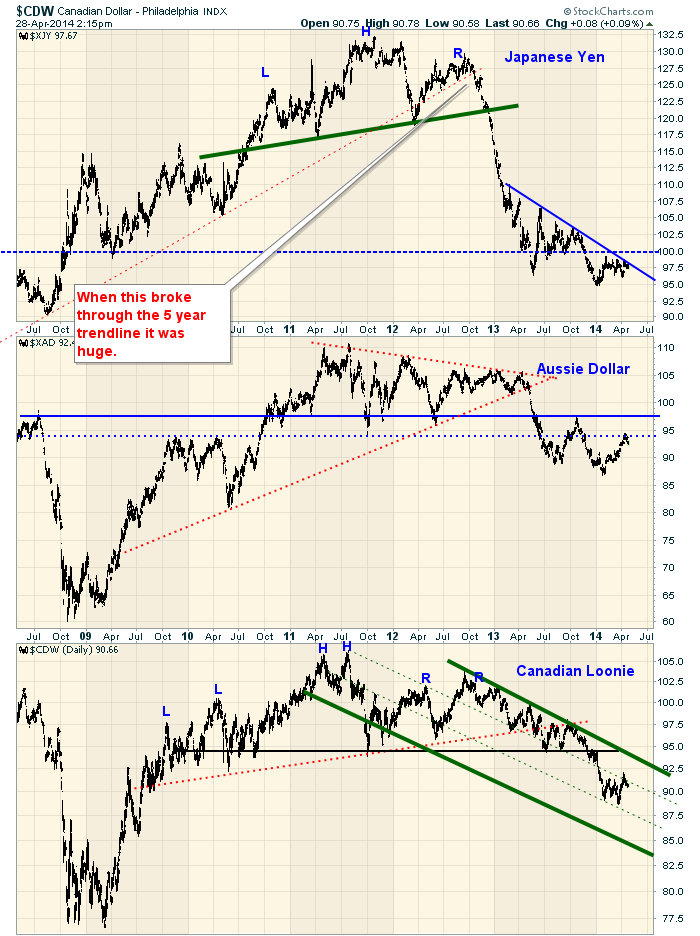
This is the big picture view. The chart title is $CDW, however, the charts are in a specific order that was decided by the breakdowns of the large head/shoulders patterns over the last few years. Those breakdowns were from the dotted red trend lines.
First of all the Yen or $XJY. The Yen is now at 97 to the $USD. If the Yen breaks higher, the $NIKKEI has historically moved inversely or in the opposite direction. Currently the Yen is below a long support/resistance line at 100 and is in a downtrend. Should the Yen continue lower, this would be good(positive) for US equities, Japanese equities and US Ten Year notes. ($TNX).The 100 level appears to be critical. it is commonly quoted the other way around as Dollar/Yen cross, so be careful which chart you are viewing.
The Aussie Dollar is another major chart that fell from grace when it broke the red trend line. We can see the solid blue line was major support. After falling well below, the Aussie tested the blue line from below and failed. Now it recently bounced up to a lower support level (call it 95) and is trying to get above there now. This is also the final level before the Aussie dollar fell in the 2008 crisis so it has a historical importance. After the 2008/2009 lows, this same level became resistance for almost a year. Where the Aussie goes from here seems important.
The Canadian Loonie looks like it paused for lunch on the way down the cascade mountain this past quarter. A head/shoulders measurement puts the target at 85 over the next few years if we measure 12 points down from the break on the red dashed line in July 2013 at 97. 97-12=85. Measuring from the break of the horizontal black line would suggest 82 for a measurement. 94-12=82.You can also see the Canadian buck appears to have aligned a couple of channels downward. I can't make a strong fit on the lower solid green line unless I use a three tiered approach. Putting the thick green line where the lower dashed green line is just seems to have too much chart action below the trend line in 2011. We'll see if my interpretation of the lower range ends up being valid. The 92.5 level was the last point of support for the Canadian dollar before it let go in 2008 and became support for Q4 2009 to Q3 2010 under the left shoulder. Another important spot.
The Japanese equity market, the Aussie equity market and the Canadian equity market have all surged higher on currency weakness. Will the weak currencies continue? If all three break higher from their downtrends this could be a big pivot point. The other side of this trade is the strength in the $USD. While the Dollar Index has a huge weighting against the Euro zone, these three countries have seen positive equity indexes since the breakdown in the currencies. These 3 charts would suggest the $USD continues higher to keep these charts in the current trend.
I'll publish another blog regarding the Euro currencies.
Good trading,
Greg Schnell, CMT.
We try to keep our articles informative and entertaining. Make sure you check out the other blog writer articles in Mailbag, Chartwatchers, Traders Journal, Decision Point and The Canadian Technician. All of these articles are free to subscribe to. The subscriber button is top right on most articles. One of the little known secrets of StockCharts is our Blog or Articles section. The Blog tab will bring up a view of some of the most recent articles. StockCharts.com Subscribers have two additional daily feature articles.
Lastly, Chartcon 2014 in Seattle is rapidly booking up. Click here for more information.

