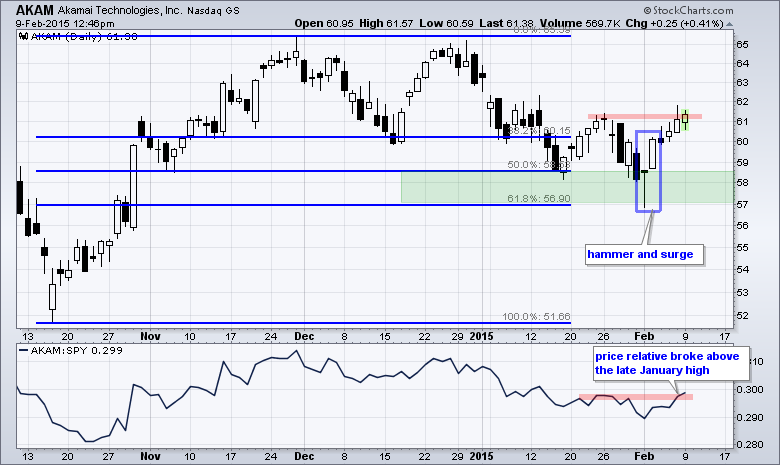
It has been a rough year for Akamai (AKAM), but the decline over the last few months looks like a classic correction. After hitting a new high in late November, the stock retraced 50-62% with a decline to the 57-58 area. This retracement amount is typical for a correction within a bigger uptrend. The stock affirmed support here by forming a hammer on February 2nd and surging the very next day. This surge confirmed the hammer and the short-term trend is up. AKAM is now challenging the late January high and a breakout here would suggest that the correction is ending and the bigger uptrend is resuming.
Click this image for a live chart

About the author:
Arthur Hill, CMT, is the Chief Technical Strategist at TrendInvestorPro.com. Focusing predominantly on US equities and ETFs, his systematic approach of identifying trend, finding signals within the trend, and setting key price levels has made him an esteemed market technician. Arthur has written articles for numerous financial publications including Barrons and Stocks & Commodities Magazine. In addition to his Chartered Market Technician (CMT) designation, he holds an MBA from the Cass Business School at City University in London.
Learn More