Alibaba (BABA) has been here before. After a month long pullback on the IPO, Alibaba broke out for a 40% gain. After slowly winding back, BABA gapped down on earnings and has come down to test the previous low. While Alibaba has intraday moves below $85, it has only had one close at $84.95. That was the lowest close for Alibaba. So that brings today's chart into play. Today's intra day range was so tight that it generated a very short low range doji.
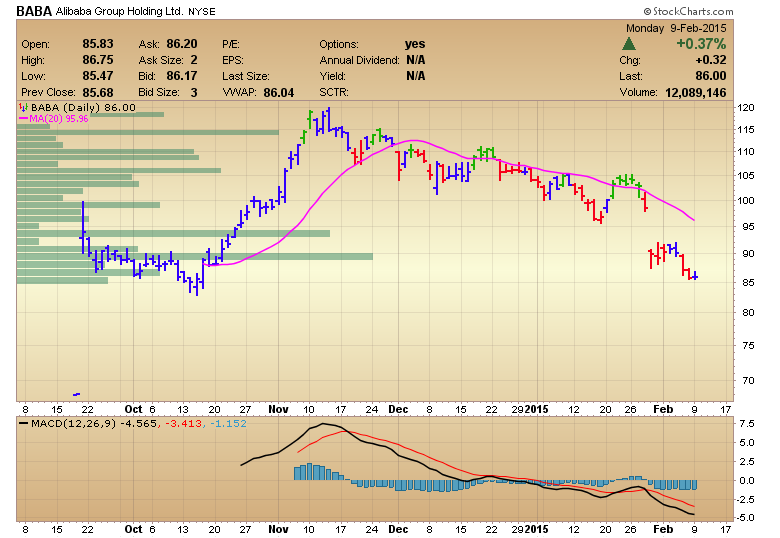
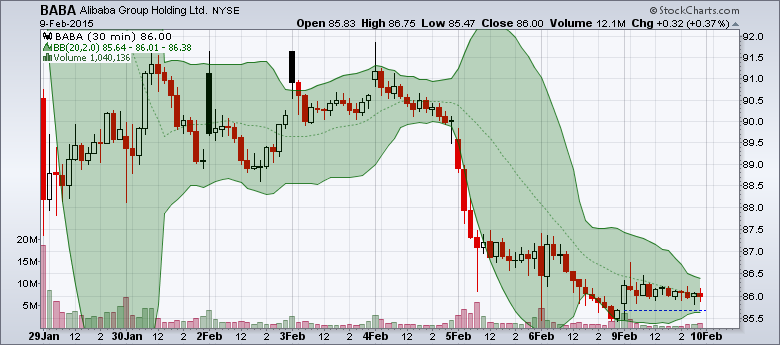
This is the lowest area of closes on the chart. I used the new volume by price feature to define the total volume at each price bar. It would appear the last time down here we ran out of sellers. Here is how tight the 30 minute chart looks on Alibaba.
Plan your trade, trade your plan. When I looked at Twitter (TWTR), it gapped down hard (25%) when previous support didn't hold.
Good trading,
Greg Schnell, CMT
