The $SPX has been drifting lower about a 1/2% a day for a couple of weeks now. No real menacing selloff, just a continued lack of buyers at higher levels. With the election fast approaching, we have some nervousness. However, from a technical perspective, there are reasons to expect a real bounce in the next few days. I'll use the SPY SPDR ETF to demonstrate to support.
In the top panel, we don't usually see the SPY in the bottom 50 % of the ETF SCTR because it represents the average of the largest, more stable stocks in the S&P 500. We can see the test of 30 on the SCTR in September. The last time we saw the SPY SCTR at 30 was on the dip in November 2012 which marked the start of a two year run. So that can be a used as an oversold indicator briefly.
However, the price is currently testing both the long trend moving average at 206 and a major horizontal support level at 207. We closed at 208.78 after going lower 8 days in a row.
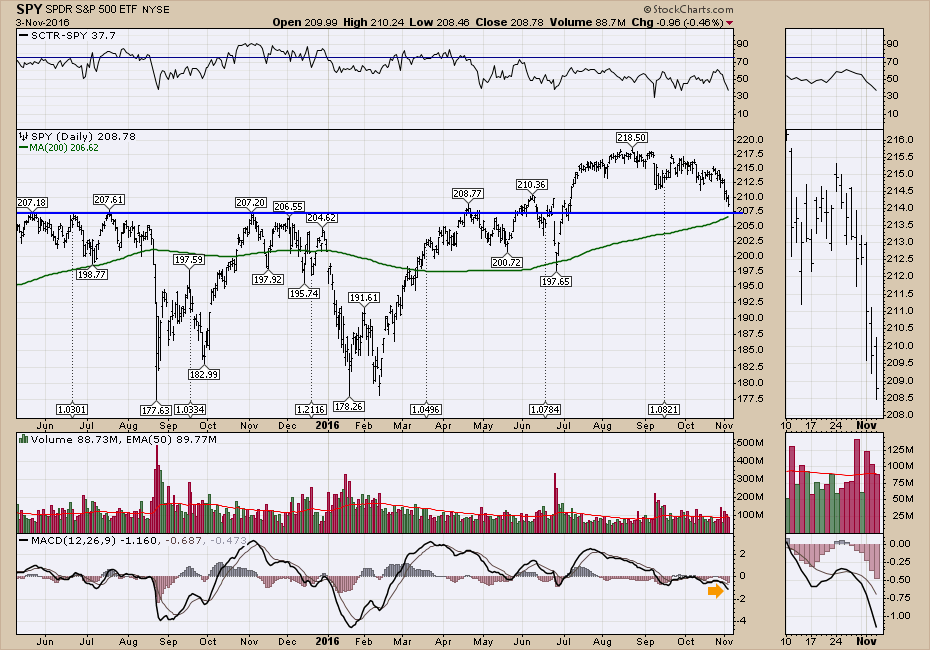
The MACD made its lowest level since February. All of these combine to say we are near an interim low. We have many other indicators ringing those bells as well.
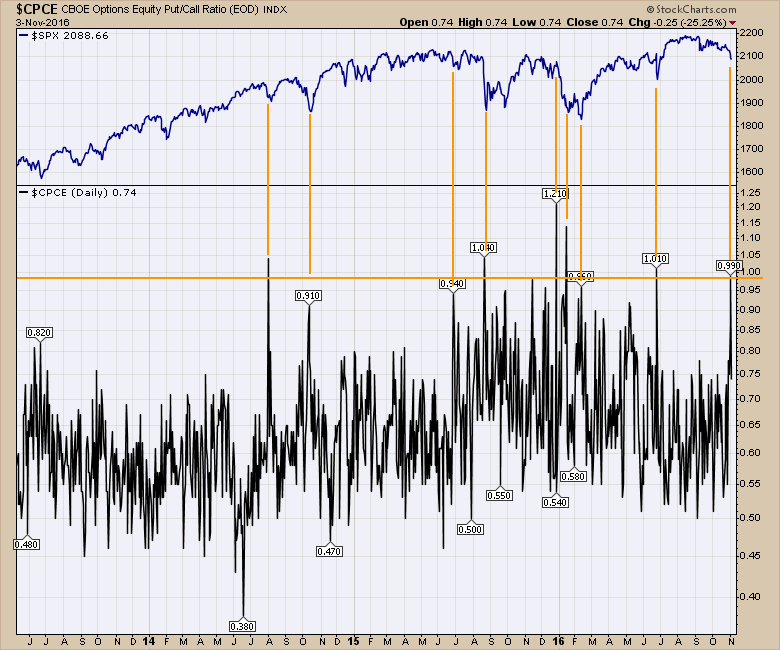
Here is the Put Call ratio ($CPCE). The highs in the Put/Call ratio coincide nicely with some of the major lows. The other point to note though, is how long do the bounces last? That is a big variable. Some are very brief, others are major bounces that last 6 months. I have drawn a line around the 0.98 level that just shows the major peaks in the put call ratio. The highest put call ratio on the chart, was just before the major drop from December 2015 - January 2016. So the bounce was not much solace as it quickly retreated again.
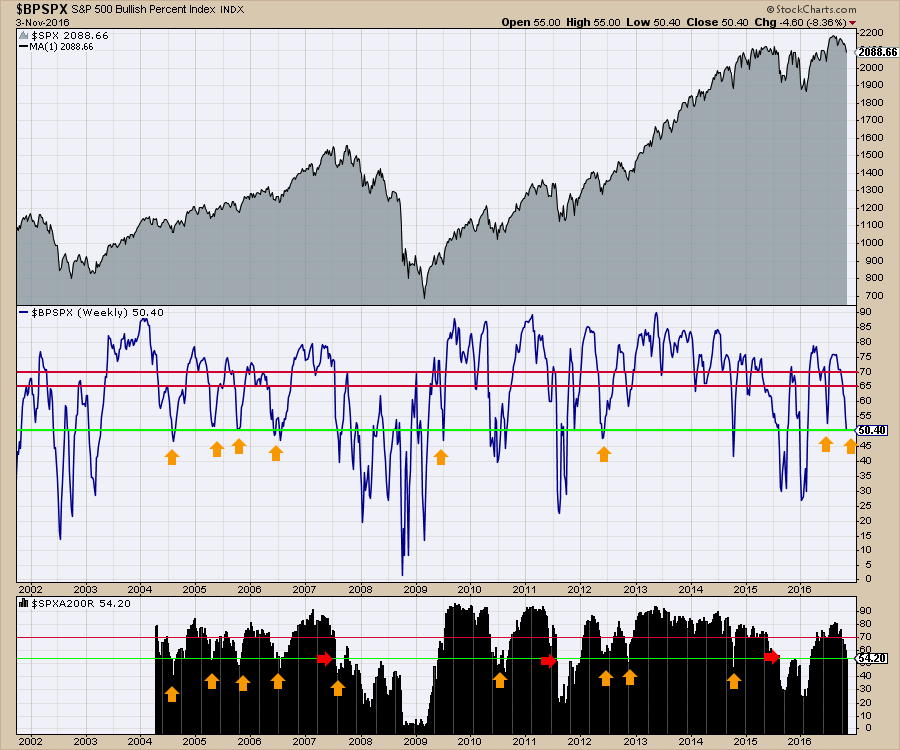
 Breadth is also a problem but it is low enough to potentially signal a bull bounce is due. For the $SPX it is near a place it usually gets support at 50% on the $BPSPX. However, there are three places noted with red arrows on the lower panel that the market continues to fall rapidly after more than 45 % of the stocks fall below the 200 DMA.$SPXA200R.
 All of these suggest the market is at a level where we might expect a bounce. How big the bounce will be is important but you can't tell that when you are trying to find the low.
For the longer term, one concerning chart is rolling on the SCTR chart to a wider view. When the SCTR for the SPY continually dips below 40, usually this is associated with a much bigger downtrend.
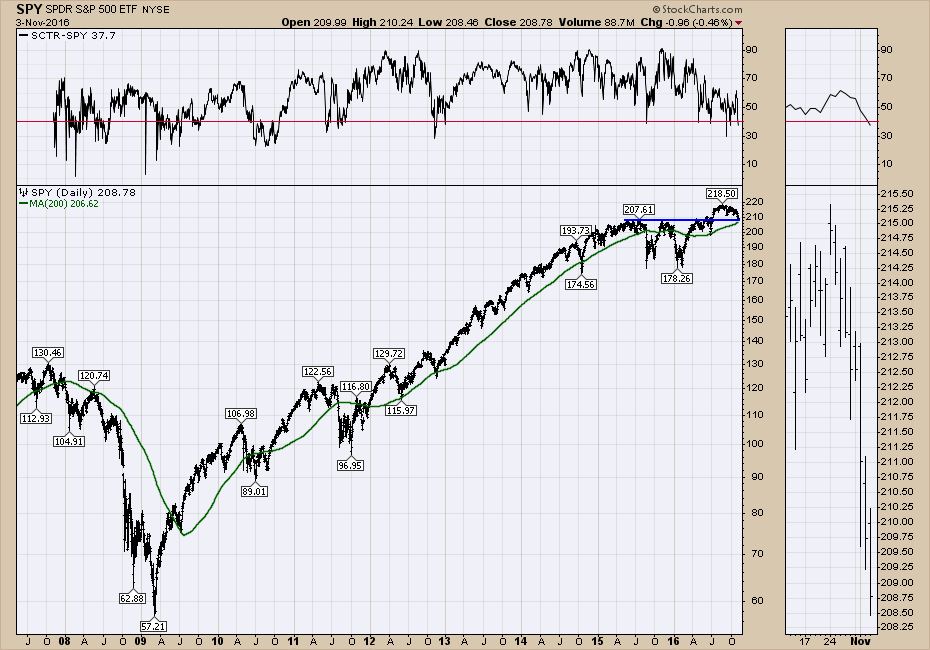 We won't know if that major weakness transpires again for a while, but at this point it sure adds questions with 5 dips below 40 in 2016. We have not used this indicator for this sort of bigger broader damage assessment before, but it could be telling us something more that might be a clue to the long term optimism. You can click on this chart to update it at any time in the future.
I posted a Commodities Countdown webinar this afternoon that described the importance of the US Dollar this week. We are at one of those major pivotal points in the intermarket relationship between currencies, commodities, equities and bonds. If you have an hour, it lays out a strong case for why the price action over the next few weeks should be extremely compelling data for the big picture. Commodities Countdown 2016-11-03.
Good trading,
Greg Schnell, CMT, MFTA.


