Continuing on our review of 2016, we move to currencies.
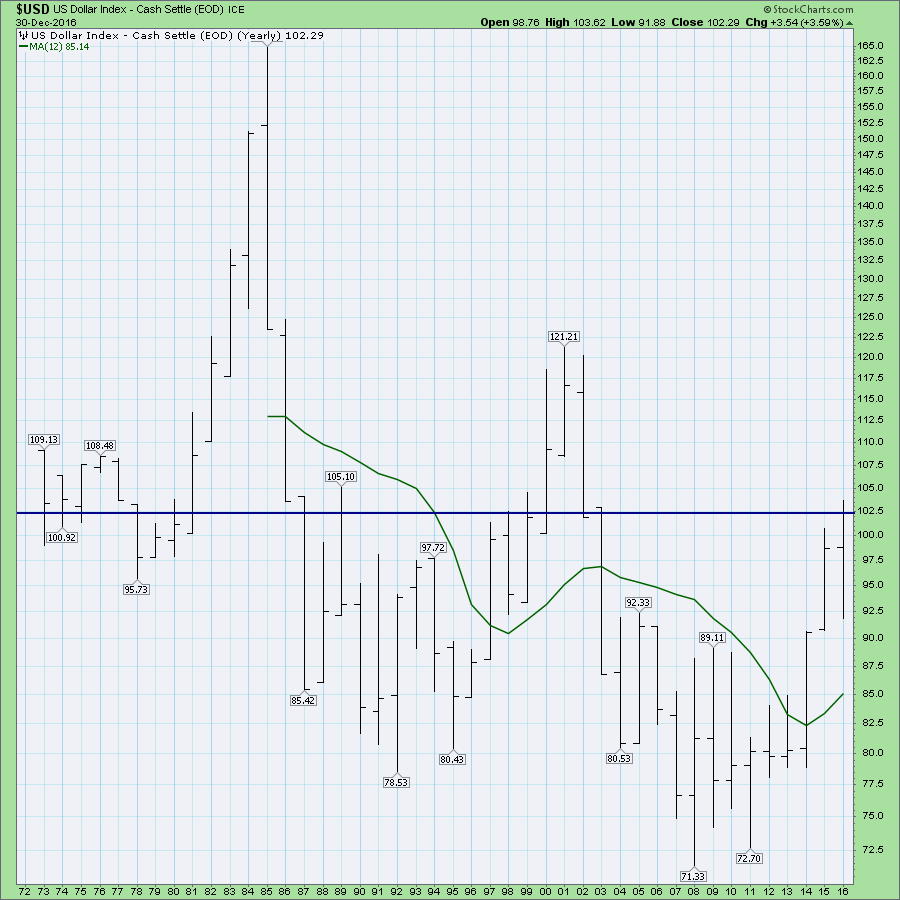
We can look at the $USD using annual bars as the data goes back to 1973. The US Dollar is almost back to where the close was in 1973. The blue line is our current level.
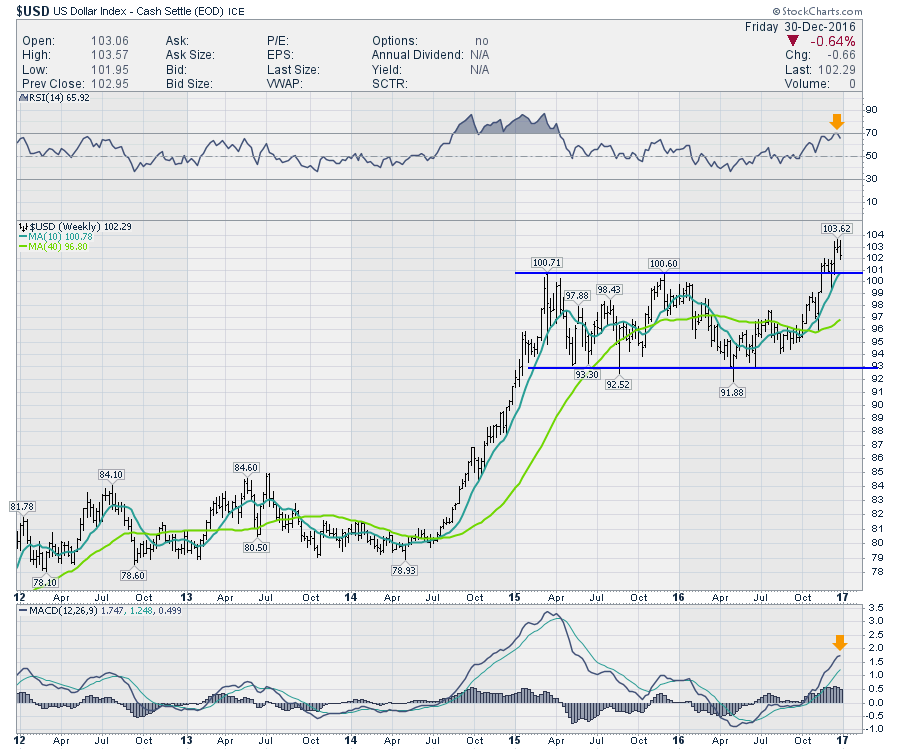
2016 marked a breakout on the $USD above a 2 year consolidation. We can see the RSI on a weekly chart is up around 70. The MACD is at the second highest level in 5 years so that is also somewhat stretched.
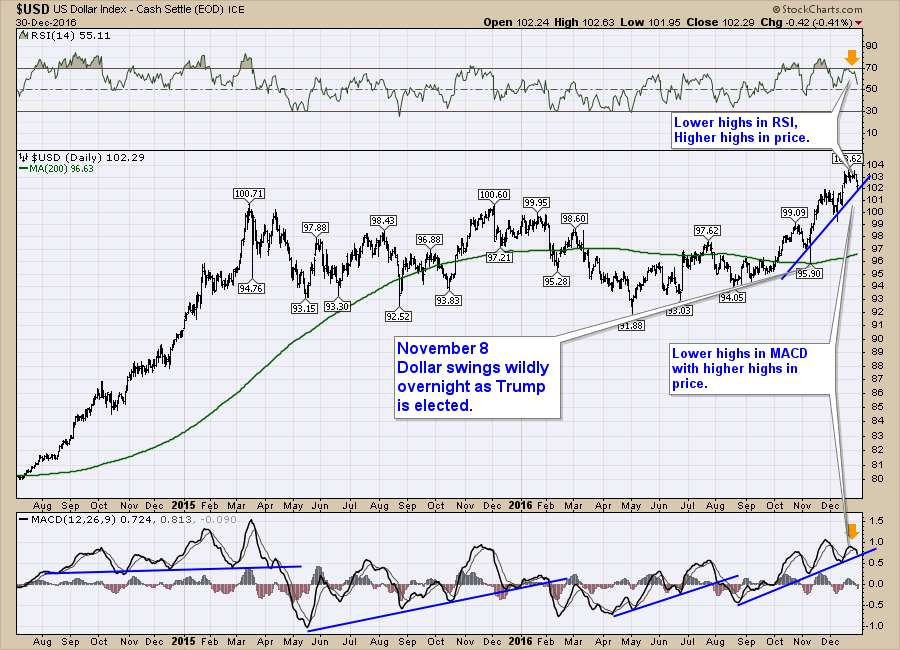
 Zooming in to look at the dollar on a daily chart, the RSI and the MACD suggest that the dollar is losing momentum even though there is a higher price on this push. The 200 DMA is upsloping at 97 and a pullback of 6 points could still be in the cards. The US Dollar has made a series of higher highs and higher lows since May 1.
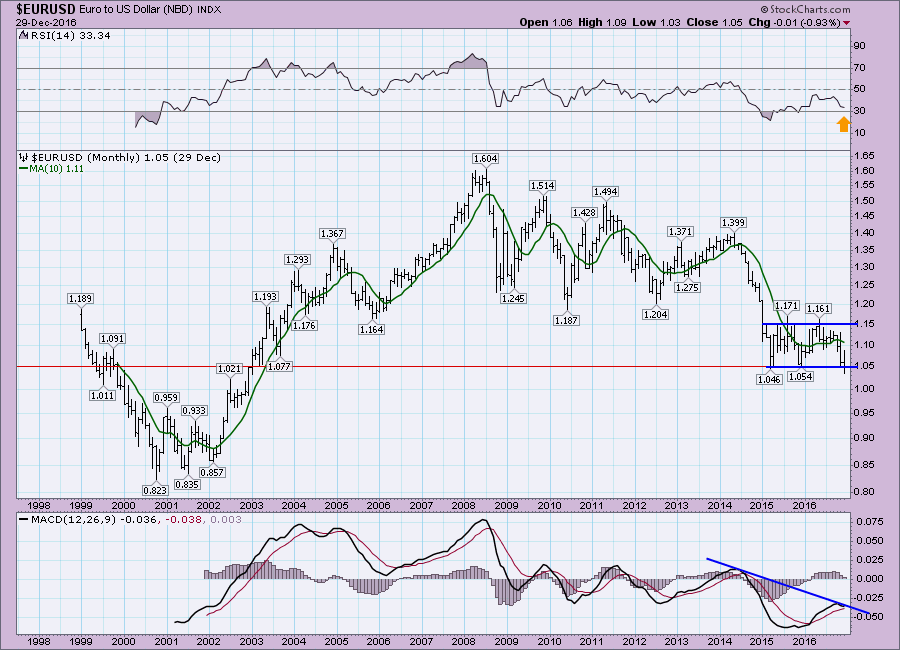
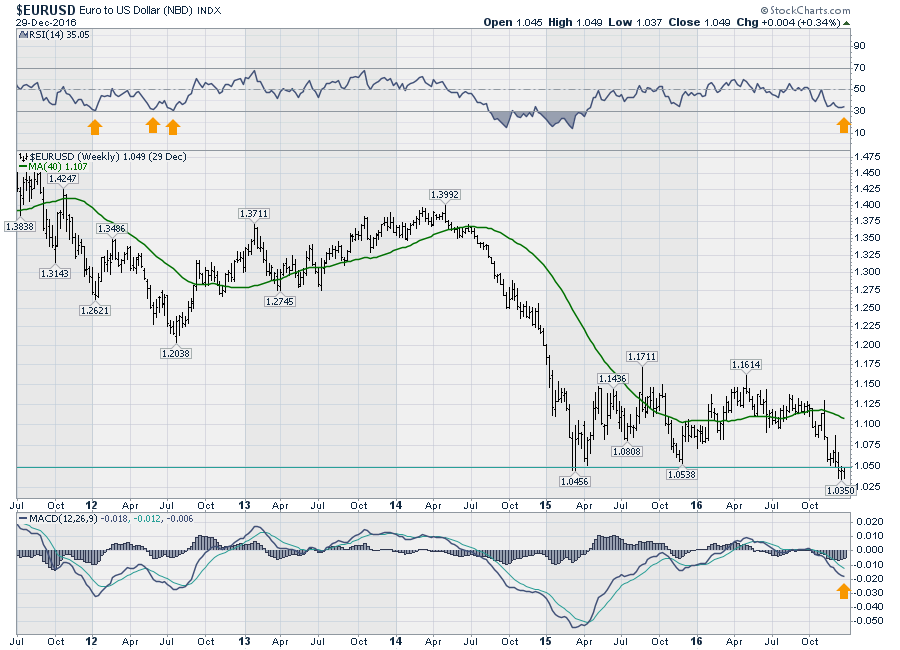
Looking at the Euro on this monthly chart, it has dropped below meaningful support around 1.05 and closed the year out right at 1.05.
 The Weekly chart for the Euro looks stretched to the downside on the RSI, but the MACD is not showing any clues. The price bars have broken below this support zone at 1.05 and are rallying right back to it, so we need to watch closely to see if former support becomes resistance. If it breaks back through to the topside, this whipsaw move below and back above support would imply an above average move on the bounce up. Having both the monthly RSI (33.49), weekly RSI (35), and Daily RSI (33) stretched down near 3o suggests we are due for a bounce. The MACD does not show any positive divergence other than the 2015 March low. The positive divergence on the October 2015 to the March 2015 low didn't play out positively. At this point the RSI is signaling on the monthly and weekly charts to expect a corrective bounce, but the MACD is not. Mixed signals.
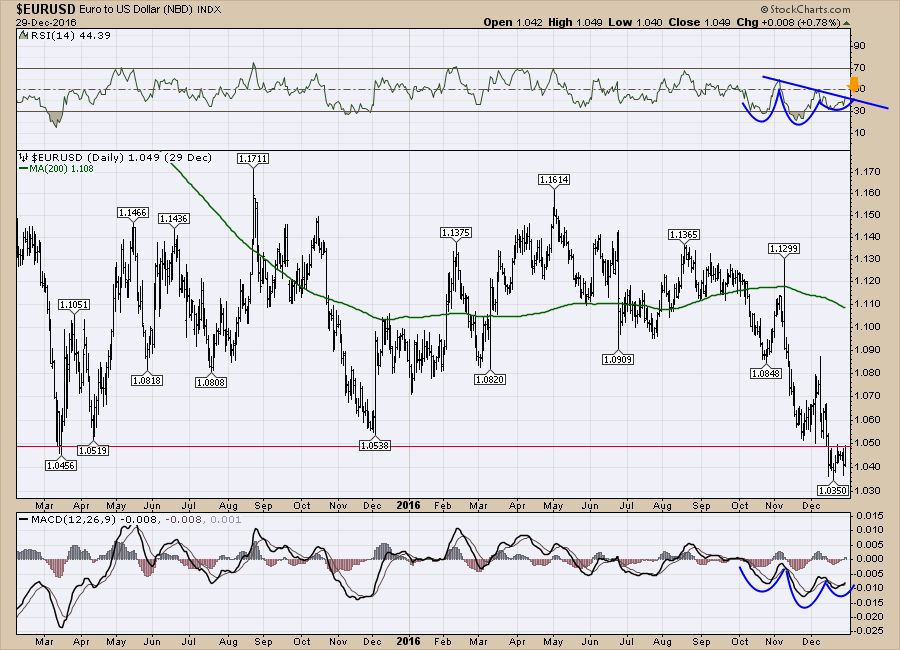
 Moving to the daily, we see some positive divergence on this low. This looks to be to be a well signaled reversal with both the RSI and the MACD making higher lows while the price makes a lower low just below support. This could be one of the biggest signals of the calendar year start if this move below support in December ends up being a whipsaw and we see the Euro shoot higher.
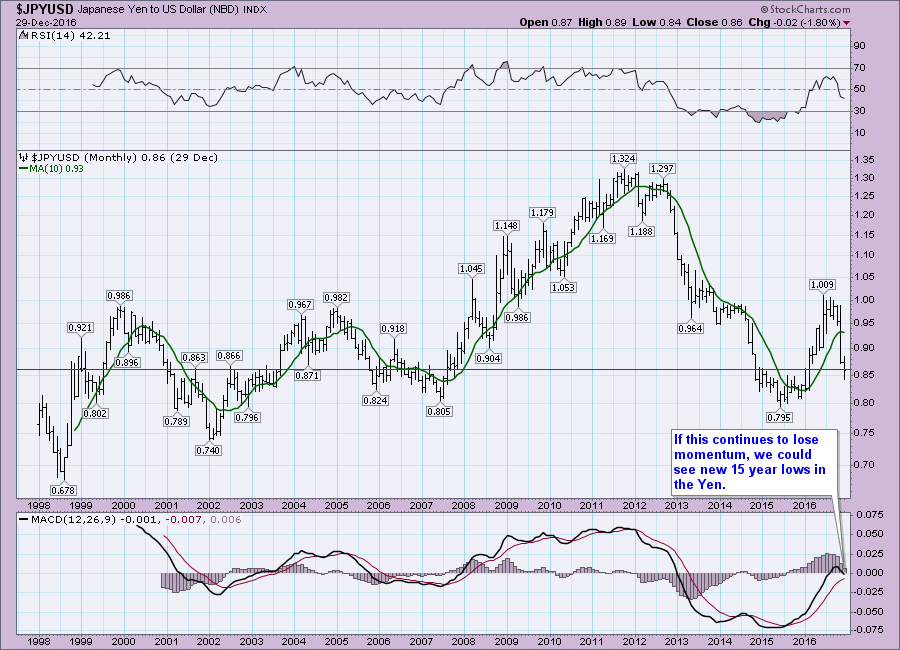
Moving onto the Yen, it was a round trip story for 2016. The Yen surged 15 cents each way!
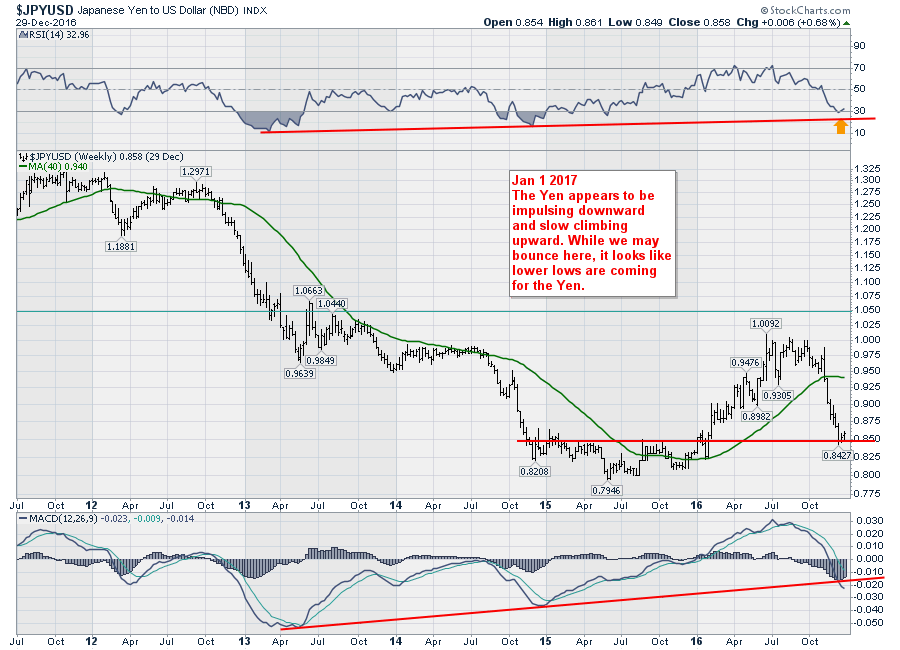
 The Yen on the weekly chart is sitting on some support. However, the impulsive move down in the last quarter suggests down is the direction of least resistance. The crack through the MACD uptrend would also imply lower momentum lows to come.
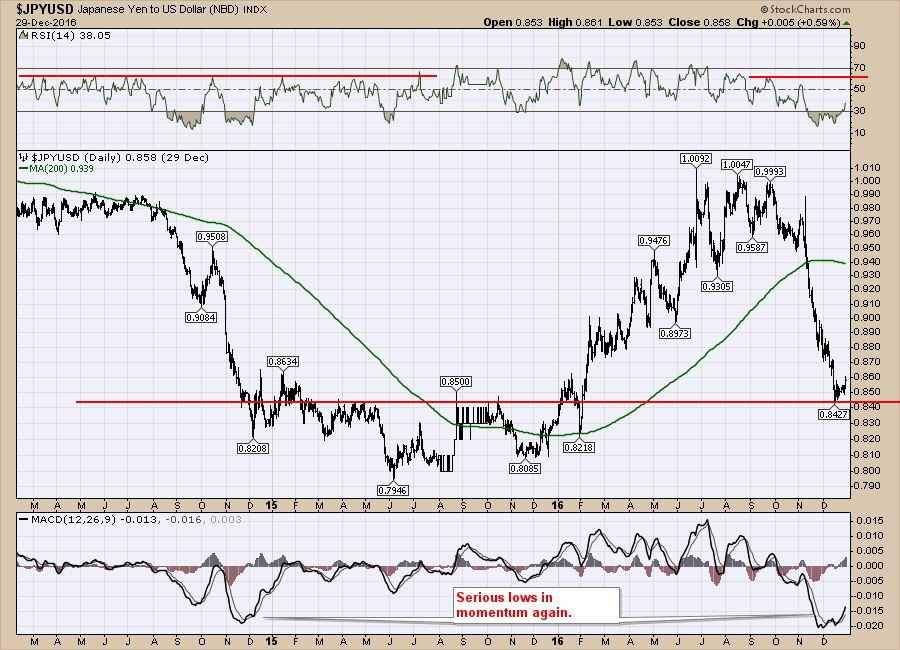
 On the daily chart, we have seen big downward thrusts in momentum recently. However, we have seen this pressure before.
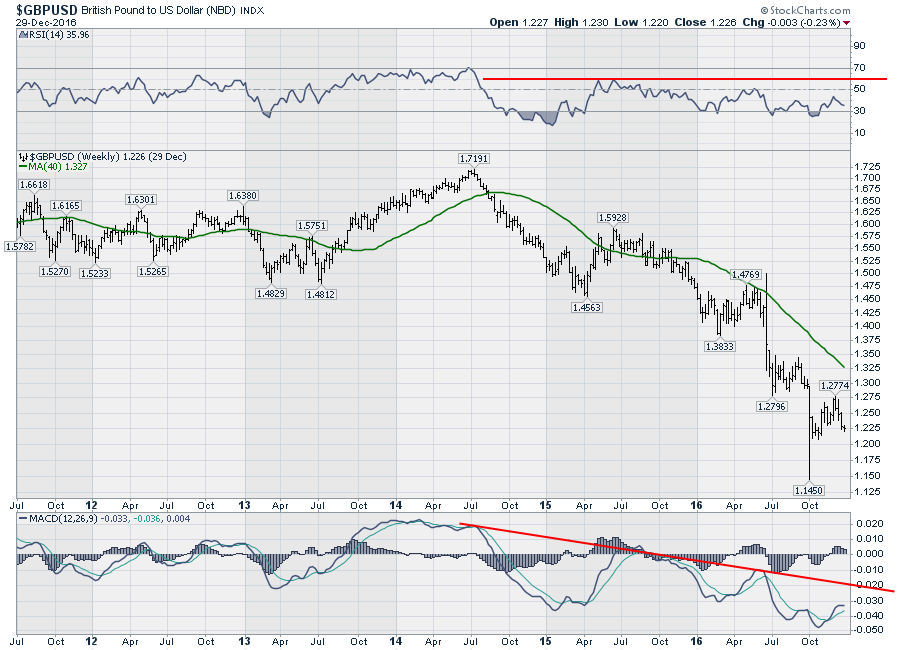
 The British Pound had an awful year in terms of resilience. It was sold with aggression all year. Currently, we still have lower lows in place on the MACD. If we can make a higher low, we can finally try to break through the downward momentum line in red.
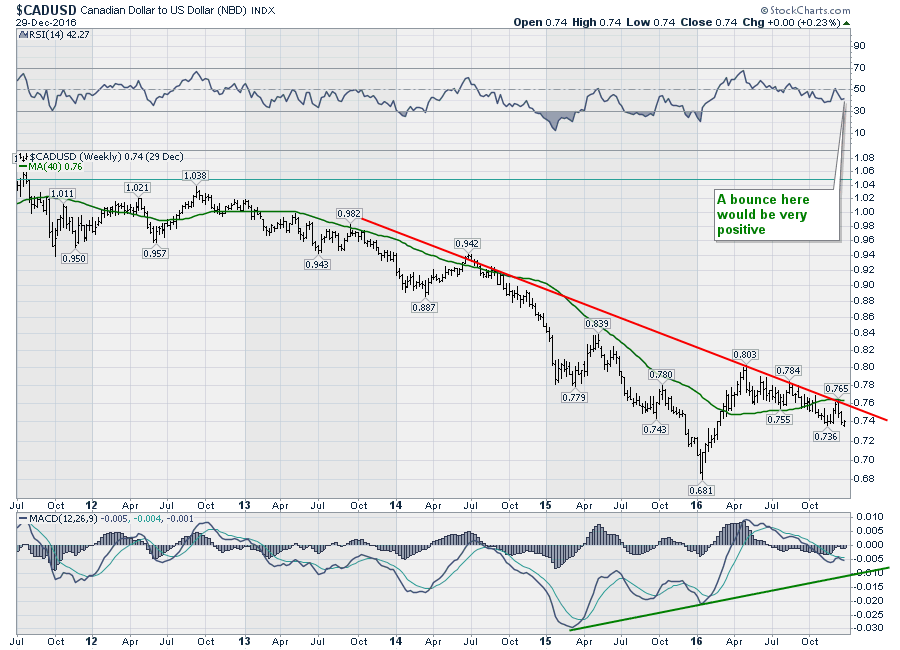
 The Canadian Dollar followed crude most of the year. As crude rallied recently, the Canadian Loonie has not followed along. That suggests a sharp reversal in crude or a strong bid coming to the Loonie. The MACD is making higher lows. We'll be watching to see if the MACD trendline can hold and the momentum for the Canadian dollar to get back above zero.
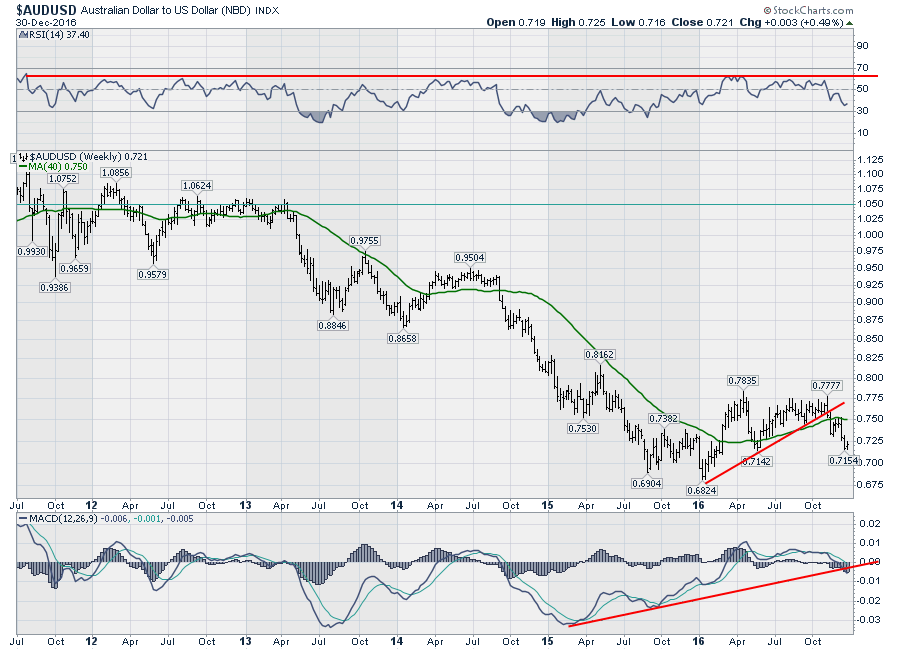
 Lastly, the Aussie dollar. The Aussie has been in a bear market for 5 years as shown by the RSI. The fact that the Aussie rallied for most of the year and has now started to break down again portends weakness in Asia. That is not bullish for Commodities. These weak trends could bleed across to Canada as the Aussie and the Canadian Dollar track each other with a high correlation as commodity countries. You'll notice both have been in a big downtrend since industrial metals started a bear market in 2011.
 In summary, the $USD looks like it might get a corrective move here in the short term. The Euro is deeply oversold and could rally for the early part of 2017. The Yen may bounce back up off support, pushing the RSI as high as 60, but I would expect the downtrend to resume later in the year. The Yen looks very weak in the big picture. The British Pound could use a year of going sideways after such extreme selling. Hard to say if that will happen but a new year, new trend wouldn't shock me. The Canadian Dollar has been subtly selling off, but the recent big selloff in the Aussie suggests more pressure for both countries currencies and the Commodities they sell. The breakout on the US Dollar above 100 is a meaningful signal for the long term. A first quarter pullback might set the stage for a renewed climb. The lower momentum on the most recent rise leads me to think some retracement is coming soon.
Good trading,
Greg Schnell, CMT, MFTA.


