Cypress Semiconductor (CY) rallied 2 weeks ago to new 52 week highs. It is still consolidating the breakout but looks well positioned. The volume last week was very low on a pullback compared to the volume on the breakout. That is a really nice bullish sign. This semiconductor stock also kicks out a yield of 3.44% which is a nice value for tech stocks.
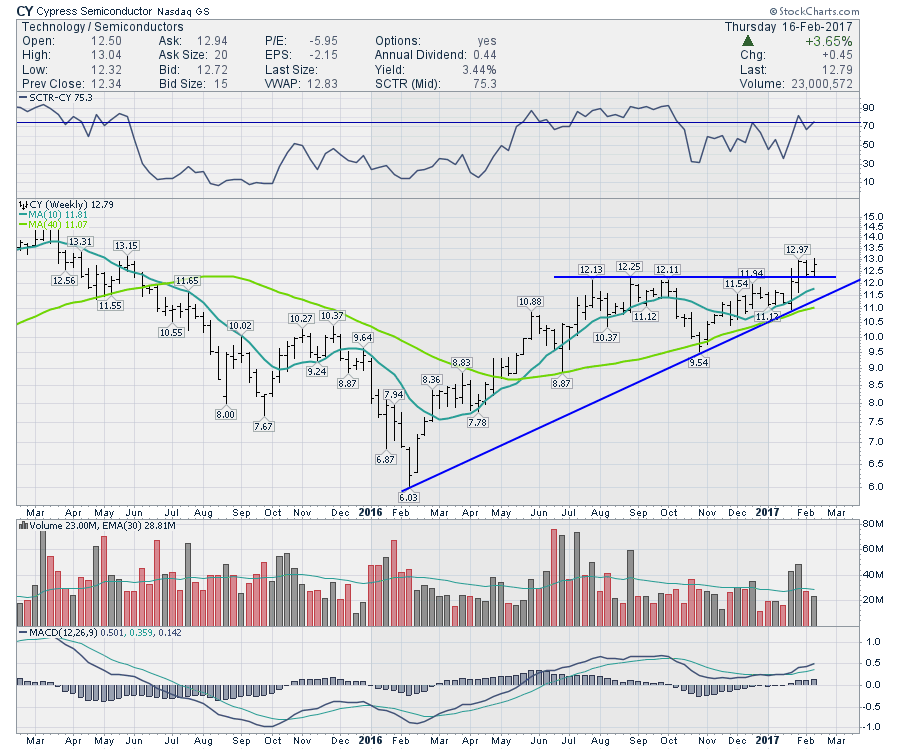 Some of the leadership in the Semiconductors have recently started to perform in line with the S&P 500 after outperforming for almost a year. Watch closely, but with a nice tight stop around $12, CY appears to be setting up to move higher if the overall market can continue the run.
Below I have listed a little inside tip for chartists who enjoy different presentations of data.
One of the unique features on StockCharts.com for members is the SharpCharts Voyeur. Sometimes it is nice to see how other members are setting up their charts and what charts are they looking at. The Voyeur program allows you to see the charts on a carousel, click on a chart to pause it, or alter the carousel time that each chart is displayed. If you have some extra screen real estate in your office this is a nice feature. It is also nice to use rather than a screen saver as the charts move continually. The benefit of being a member is the ability to find unique setups and then work to set up each chart in a similar or exact style. Visitors to the StockCharts.com website can get a 1-month free trial right now by following this link.
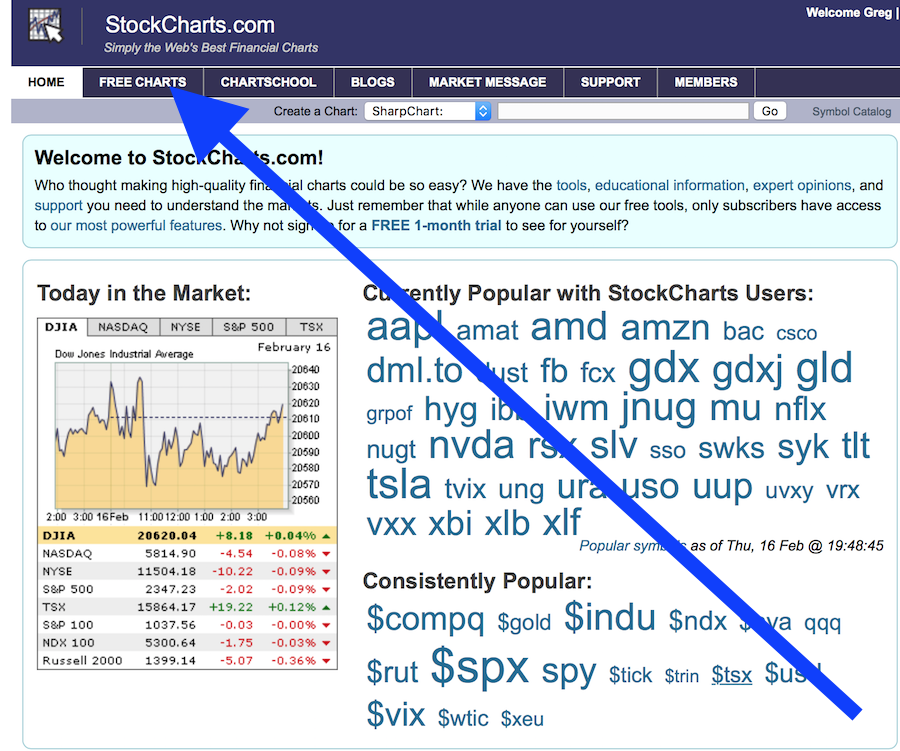
How do you find this nice tool on StockCharts.com? From the home page click on the FREE CHARTS tab.
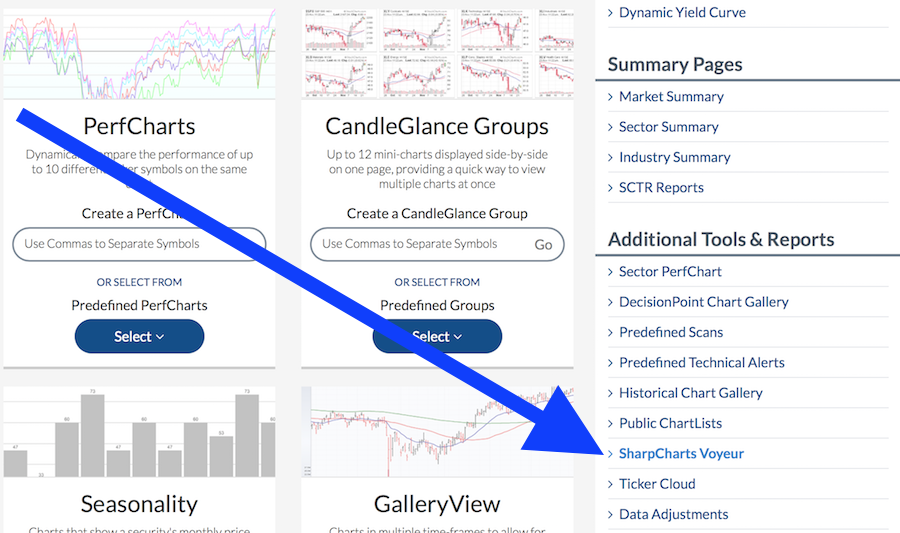
 Then click on the SharpCharts Voyeur.
 From there you will see the carousel of charts that other users are looking at. Annotations are removed automatically.
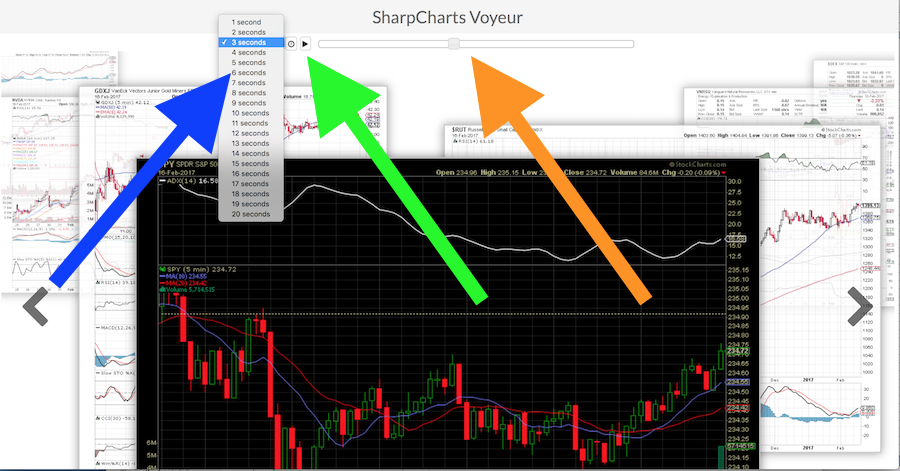
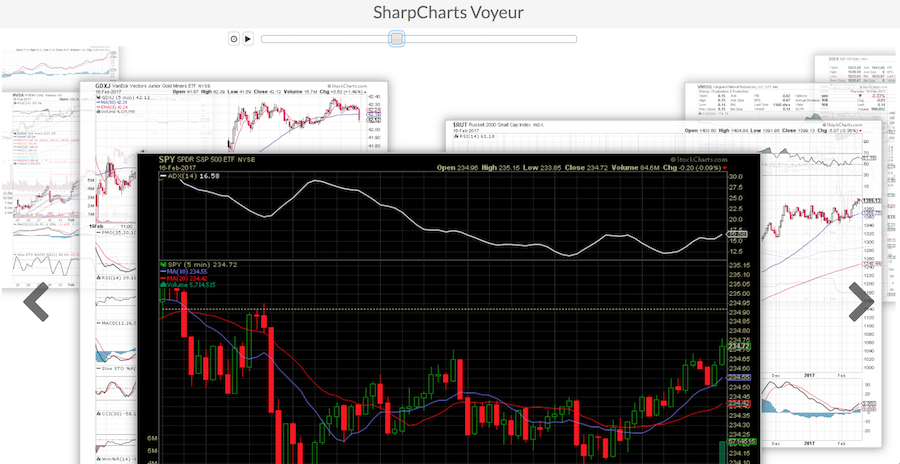 There are three simple controls at the top. The drop down menu marked by the blue arrow controls the time each chart is displayed before the carousel moves to the next chart. Click on any chart and the carousel stops moving until you click the play button. The play button (Green arrow) restarts the carousel playing. The slider allows you to move backward and forward through the charts.
 But the real value is finding an intriguing chart and working through to duplicate the settings into your own chartlist. It's a real unique feature exclusive to StockCharts.com if you are looking for nice presentation styles. Edward Tufte sympathizers will love the SharpCharts Voyeur! If you'd like to test drive StockCharts.com with a free one month trial, follow this link to check out why thousands of members have been signing up.
Lastly, I recorded a webinar on The Commodities Countdown Live 2017-02-16. There is a 2 minute discussion at the beginning where my screen was not shared but the picture will resume. If you trade Commodity related stocks, you might find it an intriguing presentation.
Good trading,
Greg Schnell, CMT, MFTA.


