Mondelez International (MDLZ) had a rough week, tumbling over 5.5% after Kraft Heinz (KHC) made a bid for Unilever (UL). That suggested to many investors that the likelihood of a MDLZ acquisition was significantly reduced and the stock was priced lower accordingly. The technical pattern on MDLZ remains quite bullish, however, so I'd argue that last week's weakness is opening a door for entry. There are two bullish possibilities here so let's look at the chart:
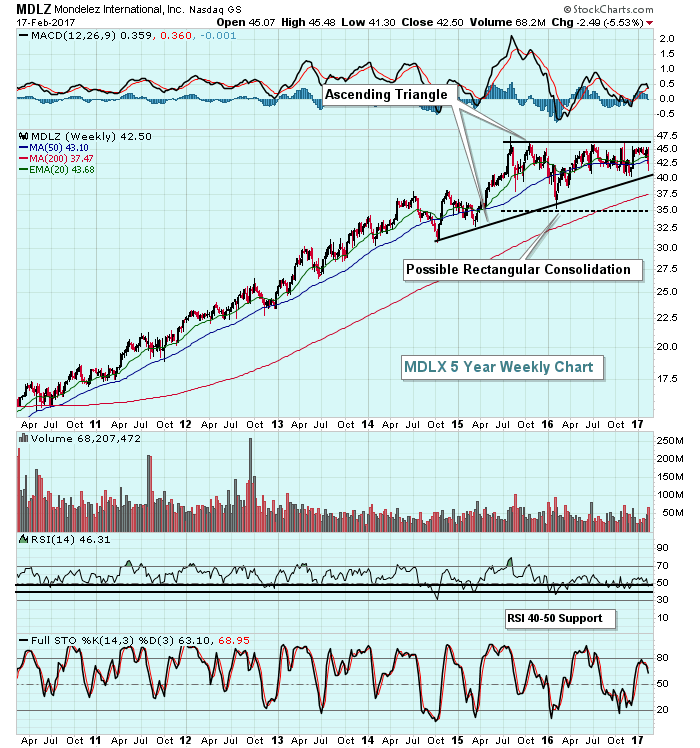 While last week's losses were obvious, the overall uptrend here is just as obvious. Weekly RSI in the 40-50 range has generally been a solid entry point into MDLZ and we closed at 46 last week. Furthermore, MDLZ is currently approaching its key trendline support within a bullish ascending triangle pattern. I'd respect this trendline because failure to hold it could send MDLZ down to its early 2016 reaction low (black dotted line above). A trip there could establish a test of price support within a bullish rectangular consolidation pattern. Either way, MDLZ looks bullish to me in the longer-term. It's just a question of whether the short-term produces additional weakness. Last week, MDLZ printed a low of 41.30. That level down to 40.00 would represent solid short-term entry with a closing stop beneath 40.00.
Happy trading!
Tom
