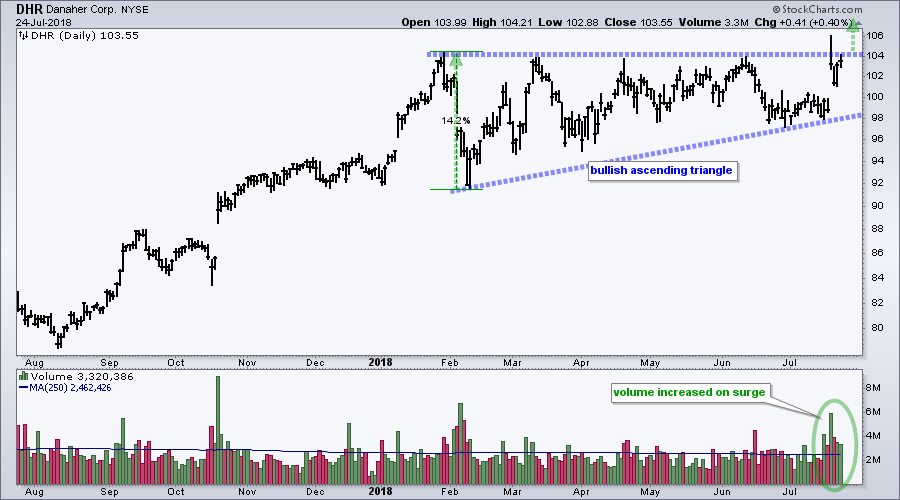
 Danaher is part of a strengthening sector (healthcare) and accounts for around 5.5% of the Medical Devices ETF (IHI), which is one of the strongest industry group ETFs this year. XLV is one of the best performing sectors over the last three months and IHI sports a parade of 52-week highs over the last few months.
On the price chart, the long-term uptrend is up because the stock recorded 52-week highs in January and July. Even though price action has been flat the last five months, an ascending triangle formed and this is a bullish continuation pattern.
The equal highs in the 104 area mark overhead resistance (supply), while the rising troughs show buying pressure coming in at progressively higher levels. A break above resistance would signal a continuation of the bigger uptrend and target a move to the 118-119 area. The height of the pattern (~14%) is added to the breakout level for a target.
The indicator window shows upside volume increasing over the six days. In fact, the stock surged on the highest volume since February and this reflects strong institutional interest.
On Trend on Youtube
Available to everyone On Trend with Arthur Hill airs Tuesdays at 10:30AM ET on StockCharts TV and repeats throughout the week at the same time. Each show is then archived on our Youtube channel.
Topics for Tuesday, July 17th:
- When to Ignore Rising and Falling Wedges
- When to Consider Rising and Falling Wedges
- Industrials, Healthcare and Finance Stand Out
- Materials Sector Underperforms (XLB, MOO)
- Bull Flags: XLV, SOXX, XSD, IBB, XBI
- Stocks: ADI, DG, DHR, EL, KSS, LOW, M, ROST
- Click here to Watch
Plan Your Trade and Trade Your Plan.
- Arthur Hill, CMT
Senior Technical Analyst, StockCharts.com
Book: Define the Trend and Trade the Trend
Twitter: Follow @ArthurHill

