 The Healthcare sector is getting a lot of attention lately. Not surprisingly as it is THE leading sector at the moment.
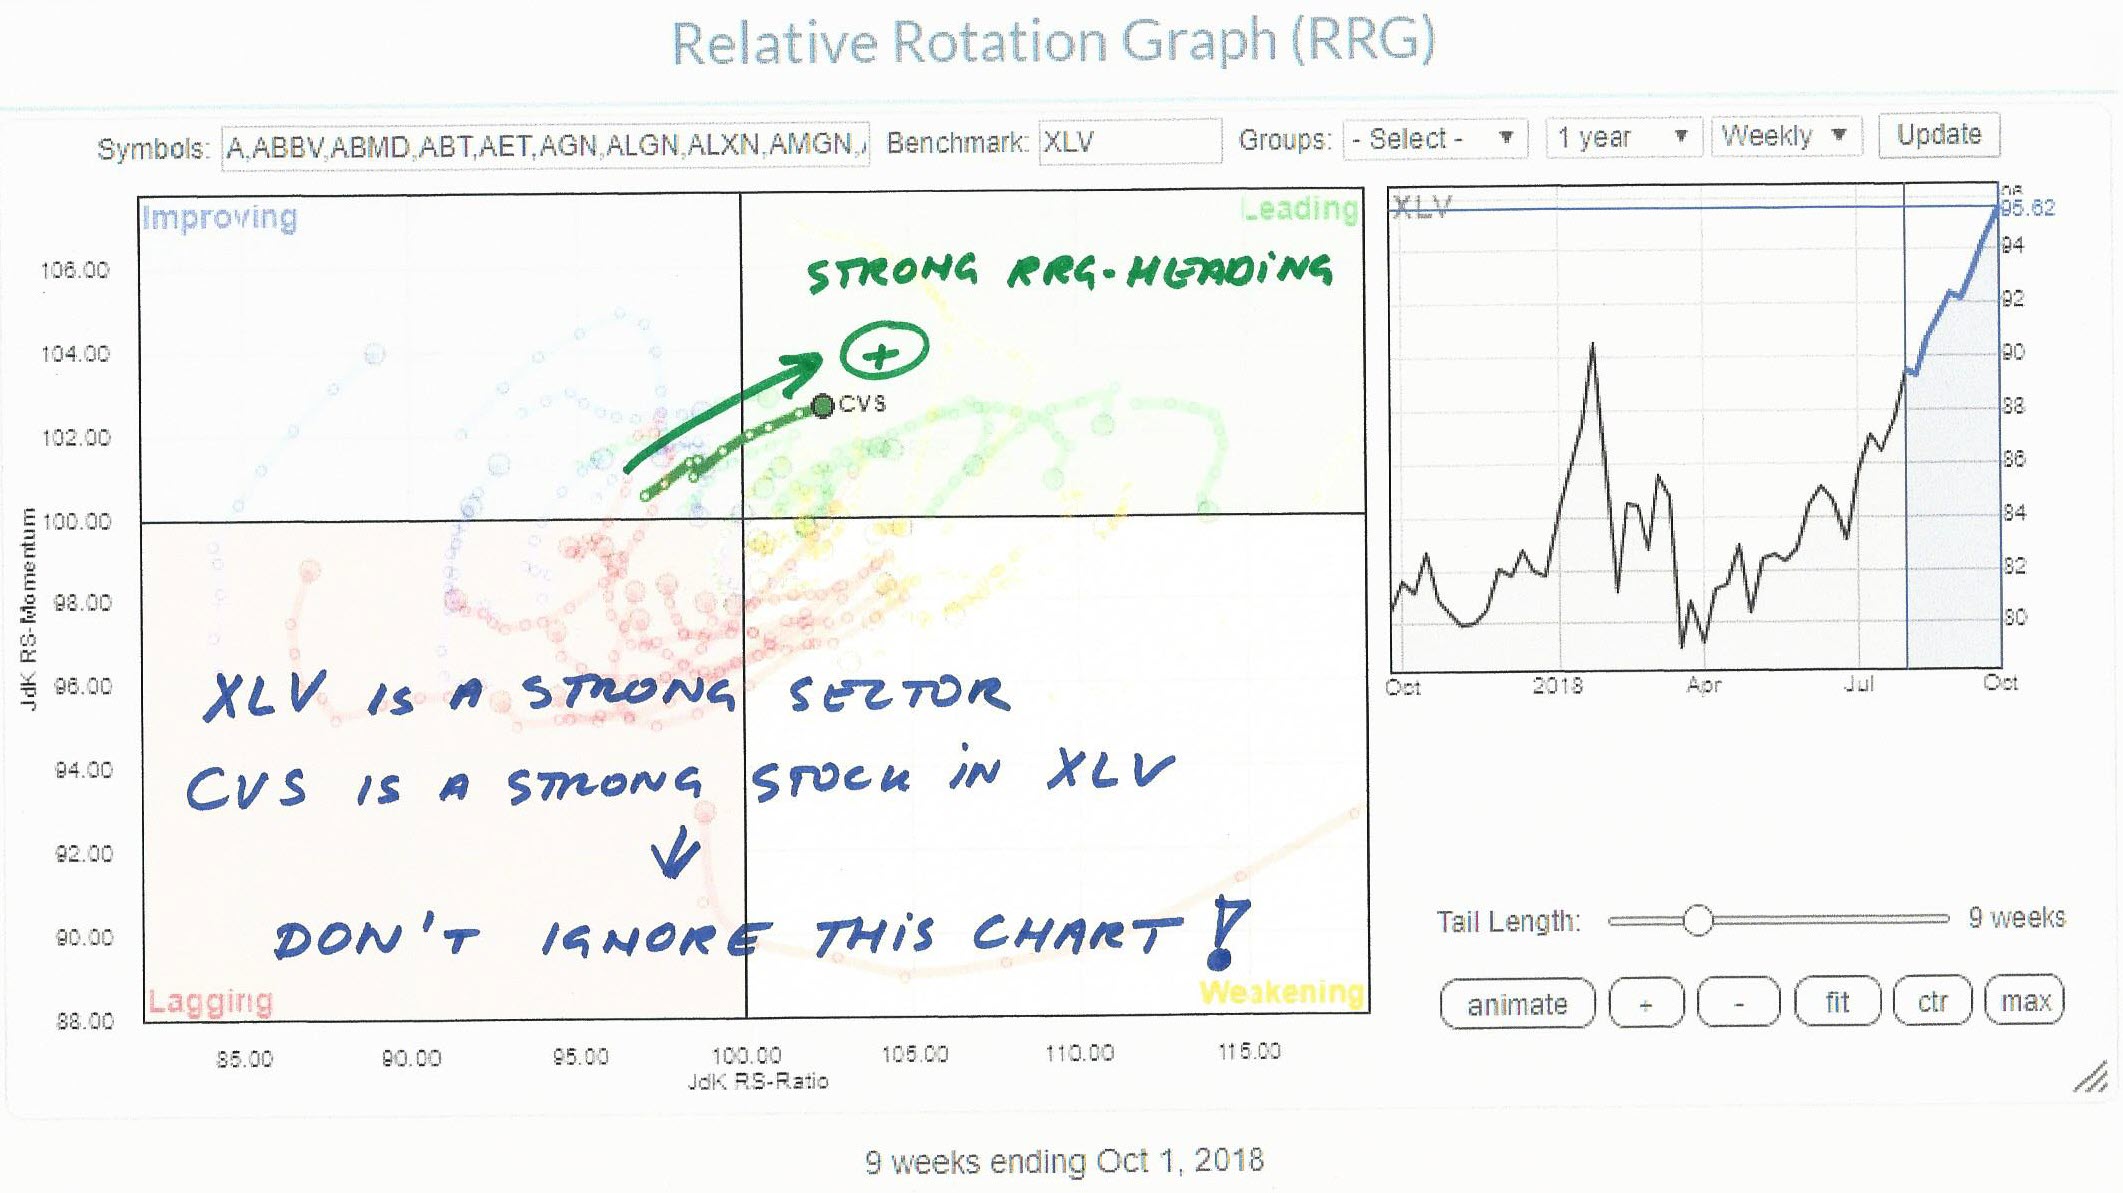
Yesterday when I was working on my most recent RRG blog, XLV made it to the headline. And for good reasons. At the moment it is the only sector inside the leading quadrant on a Relative Rotation Graph and it is pushing higher on the JdK RS-Ratio scale.
Very likely this means that there are some interesting stocks to find if we zoom in to the RRG that holds all members of XLV.
The RRG above shows the members of the Healthcare sector against XLV as the benchmark. I have highlighted CVS which dims the other stocks on the plot. In this way, you can still see how the universe behaves and rotates and still focus on one single stock of interest.
The reason for picking CVS is because the stock just crossed over from improving to leading and is maintaining a strong RRG-heading, which means a vector between the last two observations on the tail between 0-90 degrees.
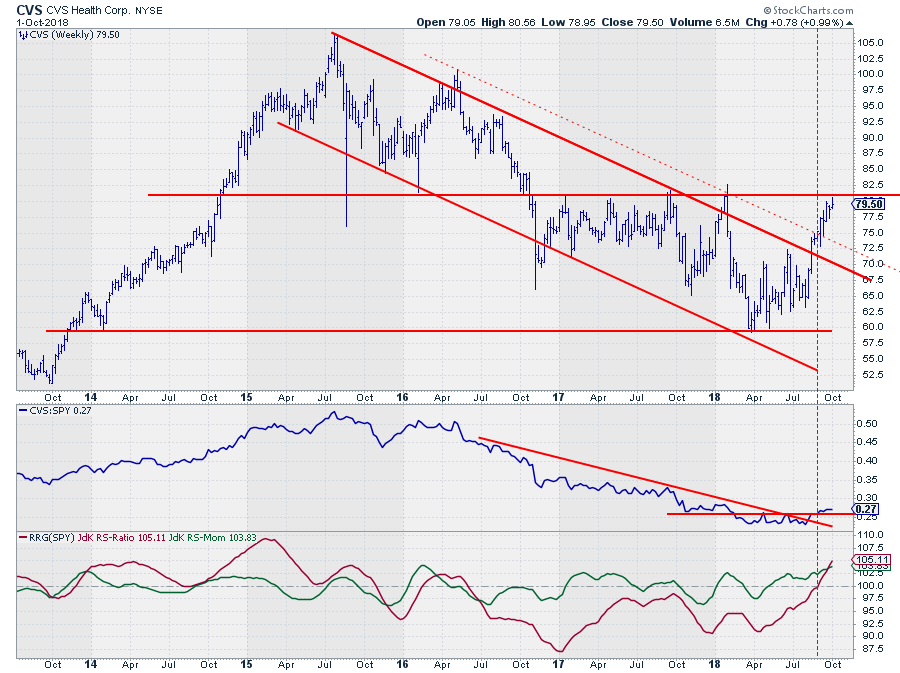 Looking at the, weekly, chart of CVS in combination with relative strength the upward break out of the falling trend channel* was a first positive sign in August. Currently, CVS is pushing against the next resistance level offered by a horizontal line that connects a number of important highs and lows over the past four years.
A break beyond this horizontal resistance area $80-$82,50 will definitely add to the positive outlook for this stock.
More positives are coming from the relative strength charts. Here also a falling resistance line was broken upward but the raw RS-Line also managed to break above the level of its two previous peaks which marks the end of the relative downtrend.
The RRG-Lines followed by breaking above 100, JdK RS-Momentum already in May and JdK RS-Ratio just recently at the end of August. This positions CVS well inside the leading quadrant now.
A short-term pull-back off of resistance is possible but a break higher will very likely make CVS one of the leading stocks in an already leading sector. Something that is better not ignored.
Let me know what you think of this usage of RRG in the comments below. If you would like to receive a notification when a new RRG blog article is published, simply "Subscribe" with your email address using the form below.
Julius de Kempenaer | RRG Research
RRG, Relative Rotation Graphs, JdK RS-Ratio, and JdK RS-Momentum are registered TradeMarks ®; of RRG Research
Follow RRG Research on social media:
Feedback, comments or questions are welcome at Juliusdk@stockcharts.com. I cannot promise to respond to each and every message but I will certainly read them and where reasonably possible use the feedback and comments or answer questions.
If you want to discuss RRG with me on SCAN, please use my handle Julius_RRG so that I will get a notification.


