
When the stock market trends higher, it doesn't necessarily mean all stocks are moving higher. This is why it's necessary to have a method to filter through the day's market action and select stocks or securities to trade that have the potential for a decent return. And since each trader is different and each trading day is different, it's a good idea to develop various scans that identify securities to trade.
Once you've developed your scans, it's good to get in the habit of running a few of them every day. This can be for several reasons—are your scans still working the way they were designed? Are you getting very few results or too many results? Each day you run the scan, it produces different results, some of which may raise eyebrows. For example, on June 21, one of the stocks that came up in the StockCharts Technical Rank (SCTR) scan was Wynn Resorts Ltd. (WYNN).
During the pandemic, casino stocks suffered, and those with exposure to Macau felt the pain for an even longer period. With China reopening, you'd expect casino stocks like WYNN to recover. But the general thought is that the recovery was priced in, and the stock is due for a pullback.
Earlier this month, Wynn was downgraded by a couple of analysts. So when the stock was one that popped up in the SCTR scan results list, it's worth focusing on the stock and analyzing it more closely.
The Big Picture: Analyzing the Leisure Industry
It may be worth doing a top-down analysis for WYNN stock. Let's start by looking at the hotel, restaurant, and leisure industry by analyzing the S&P 500 Hotels, Restaurants & Leisure Industry index ($GSPHRL). The weekly chart (click on the chart below for live version) shows that the index has been trending higher since October 2022. But it looks like it's reaching a high, which could be a resistance level for the industry. The question is whether the index will break to the upside and reach new highs.
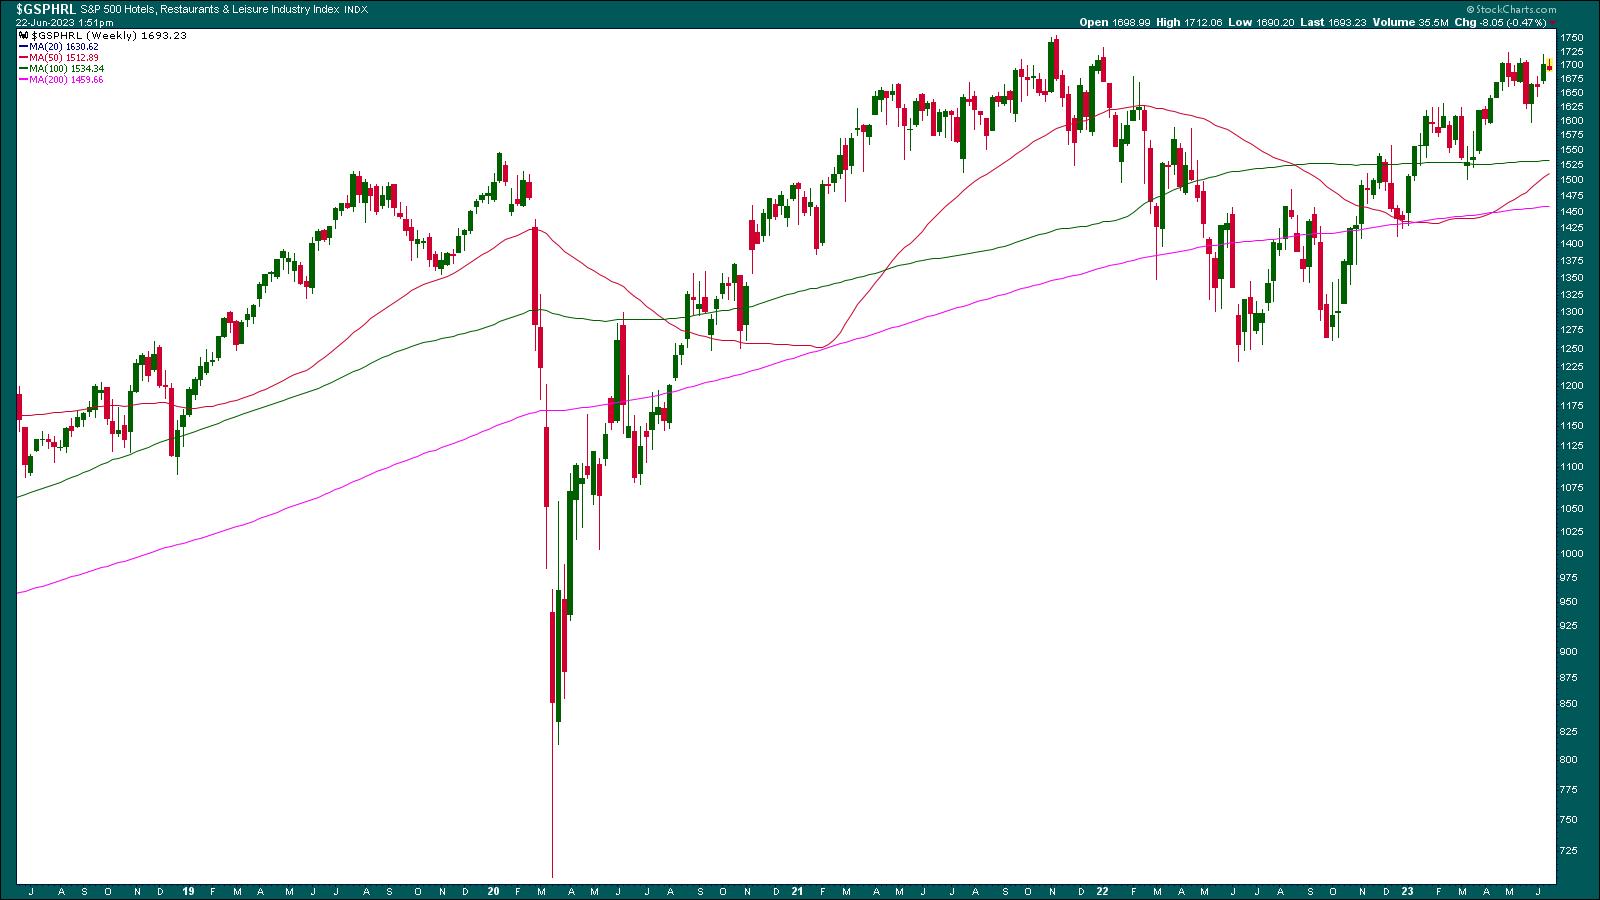
CHART 1: STARTING FROM THE TOP. An analysis of the weekly chart of the S&P 500 Hotels, Restaurants & Leisure industry ($GSPHRL) shows that this group of stocks is trending higher. However, it is pretty close to its high. Will it bust through its highs and move higher?Chart source: StockCharts.com (click on chart for live version). For educational purposes only.
The index is trading above its 50-, 100-, and 200-week simple moving average (SMA). For as long as people are spending more on discretionary items such as travel and leisure, this index could continue to move higher. But inflation is still a huge concern, and if consumers start cutting back on spending, this index could reverse quickly. So if you are considering investing in WYNN, analyzing $GSPHRL would be your starting point.
A Weekly Perspective of WYNN
Looking at the weekly chart of WYNN, you see that the stock has had its share of ups and downs. Although the stock has been trending higher since October 2022, it's had a tough time breaking above $116.90. Plus, there have been a series of lower highs since 2020.
Adding the 50-week and 100-week SMA to the weekly chart shows that the 50-week is crossing above the 100-week SMA. And that's after the stock has pulled back and bounced off its 200-week SMA. The SMA crossover and WYNN's stock bouncing off its 200-week SMA are positive signs.
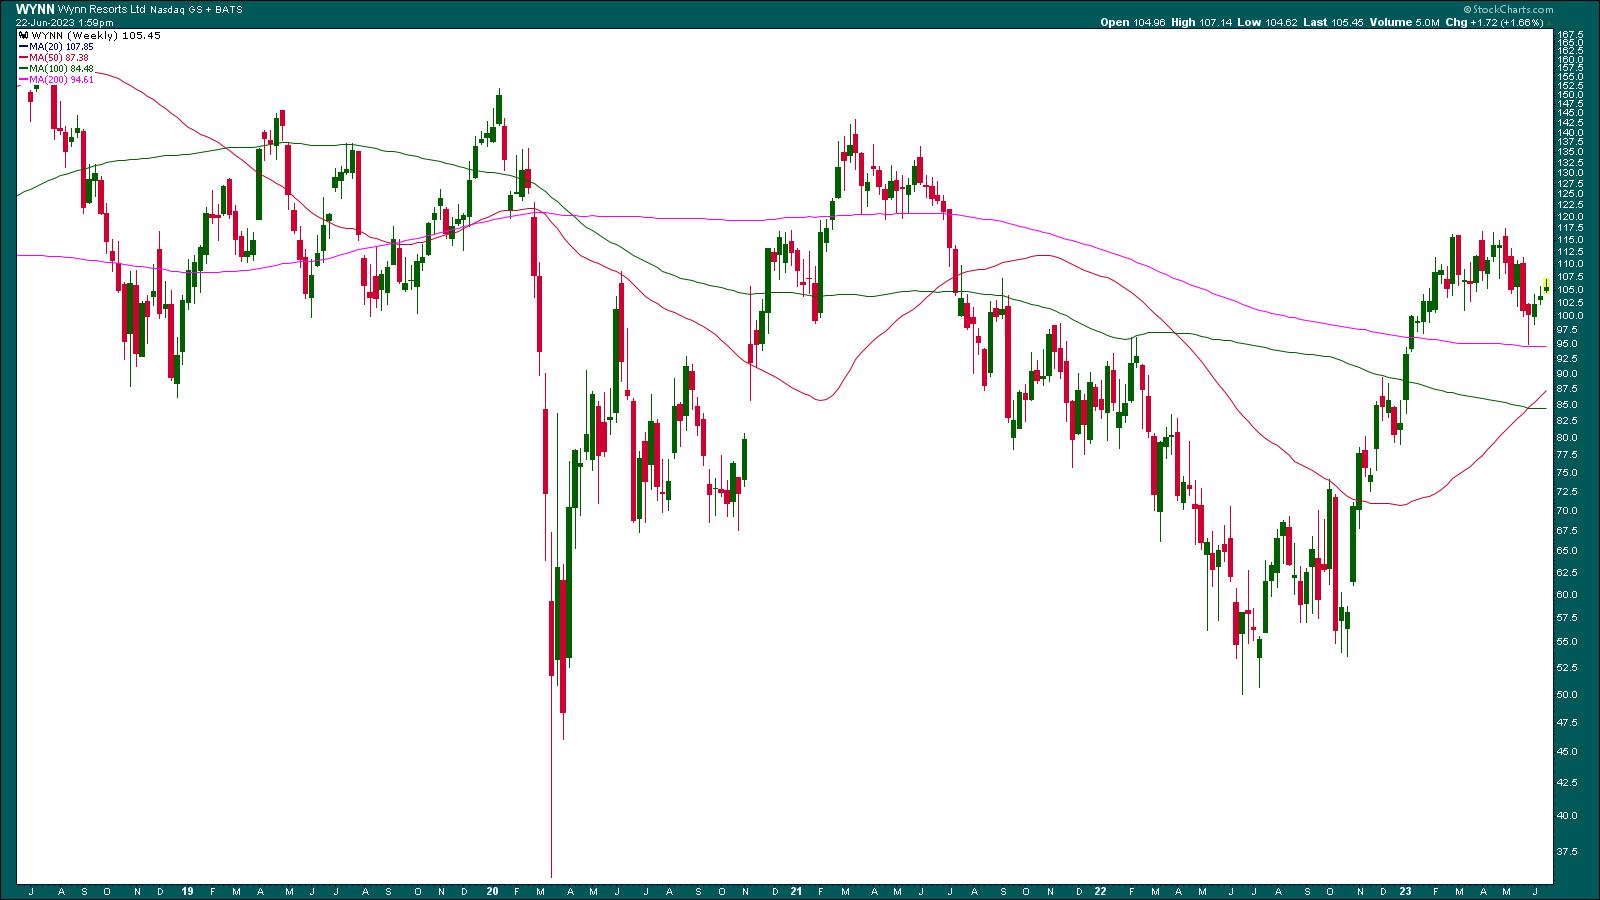
CHART 2: WEEKLY CHART OF WYNN RESORTS. The stock looks to be trending higher but it has to reverse its lower highs pattern to move higher.Chart source: StockCharts.com (click on chart for live version). For educational purposes only.
If the stock breaks above its $116.90 resistance, it could go as high as $151, the January 2020 high. That's about a $35 move, or almost a 30% move. If that happened, it would reverse the "lower highs" scenario. What are the chances of that happening? To answer that question, let's turn to the daily chart.
 Use the Inspect tool to measure the point and percent move. Place your cursor at the low and drag it to the high.
Zeroing In: Daily Price Action in WYNN
WYNN is trading above its 200-day SMA but below its 50- and 100-day SMAs. The stock has bounced below the resistance of its 50-day SMA (see zoom thumbnail in chart below).
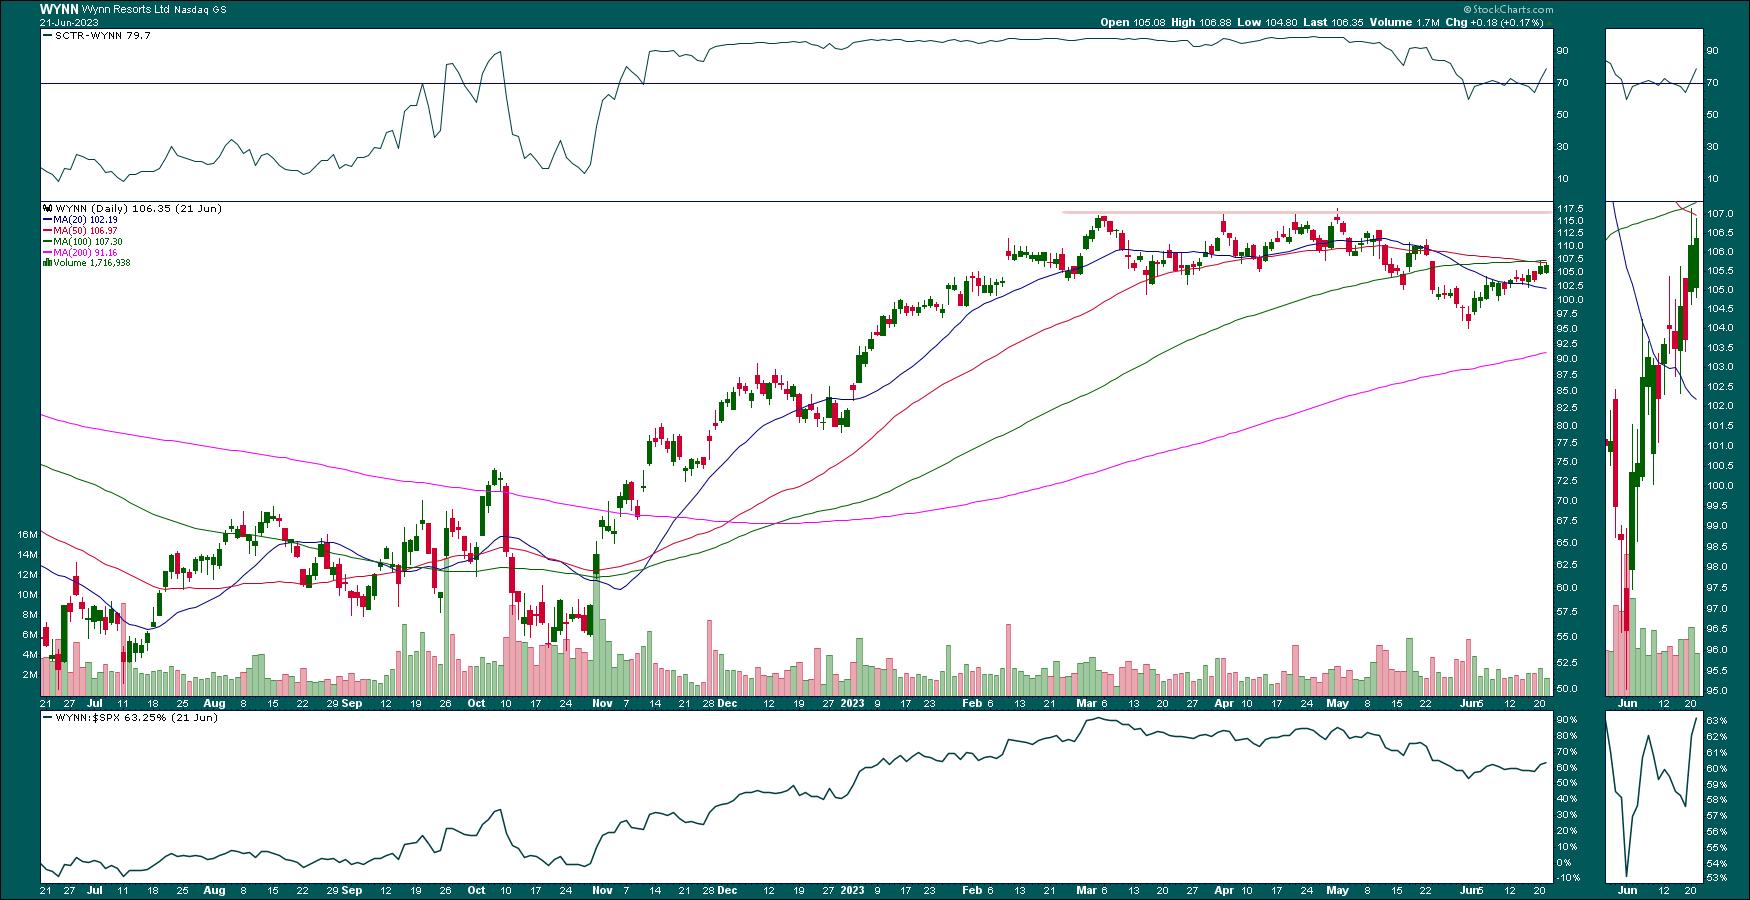
CHART 3: DAILY CHART OF WYNN STOCK. Will the stock bust through its 50-day SMA? Thats' something investors need to keep an eye on.Chart source: StockCharts.com (click on chart for live version). For educational purposes only.
So, the first area to look at would be to see if WYNN breaks above the 50-day SMA. If it does, the next area would be the $116.90 resistance. The stock is still far away from that level. The SCTR is above 70, and WYNN's relative strength relative to the S&P 500 index ($SPX) is above 70%. So, overall, the stock looks like a candidate for your ChartLists.
How to Trade WYNN Stock
- The first hurdle for WYNN is to break above its 50-day SMA. If you're considering trading WYNN stock, set an alert for when the stock crosses above its 50-day SMA. If the breakout occurs with above-average volume, it increases the odds of the stock moving to the $116.90 level.
- If price fails to break above the 50-day SMA, keep an eye on price action at a shorter-term SMA, such as the 20-day. It could bounce off this SMA, or it could break below it. A break below could send the stock much lower, which may be a good reason to delete the stock from your ChartList.
- This type of trade may require patience, and if you decide to enter a long position, as long as entry conditions are met, it may not be a long-term play. It all depends on what the stock does at its next resistance level. From the weekly chart, the stock could go as high as $151, but take it one day at a time.
Other Stocks From the Scan
Here are some other stocks that showed up on the large-cap SCTR scan.
Baidu, Inc. (BIDU)
FedEx Corp. (FDX)
Lattice Semiconductor Corp. (LSCC)
Lululemon Athletica Inc. (LULU)
Micron Technology (MU)
Snowflake Inc (SNOW)
Looking Back at Intel
On June 13, Intel Corp. (INTC) was the featured SCTR scan stock. Let's look at how that stock is performing.
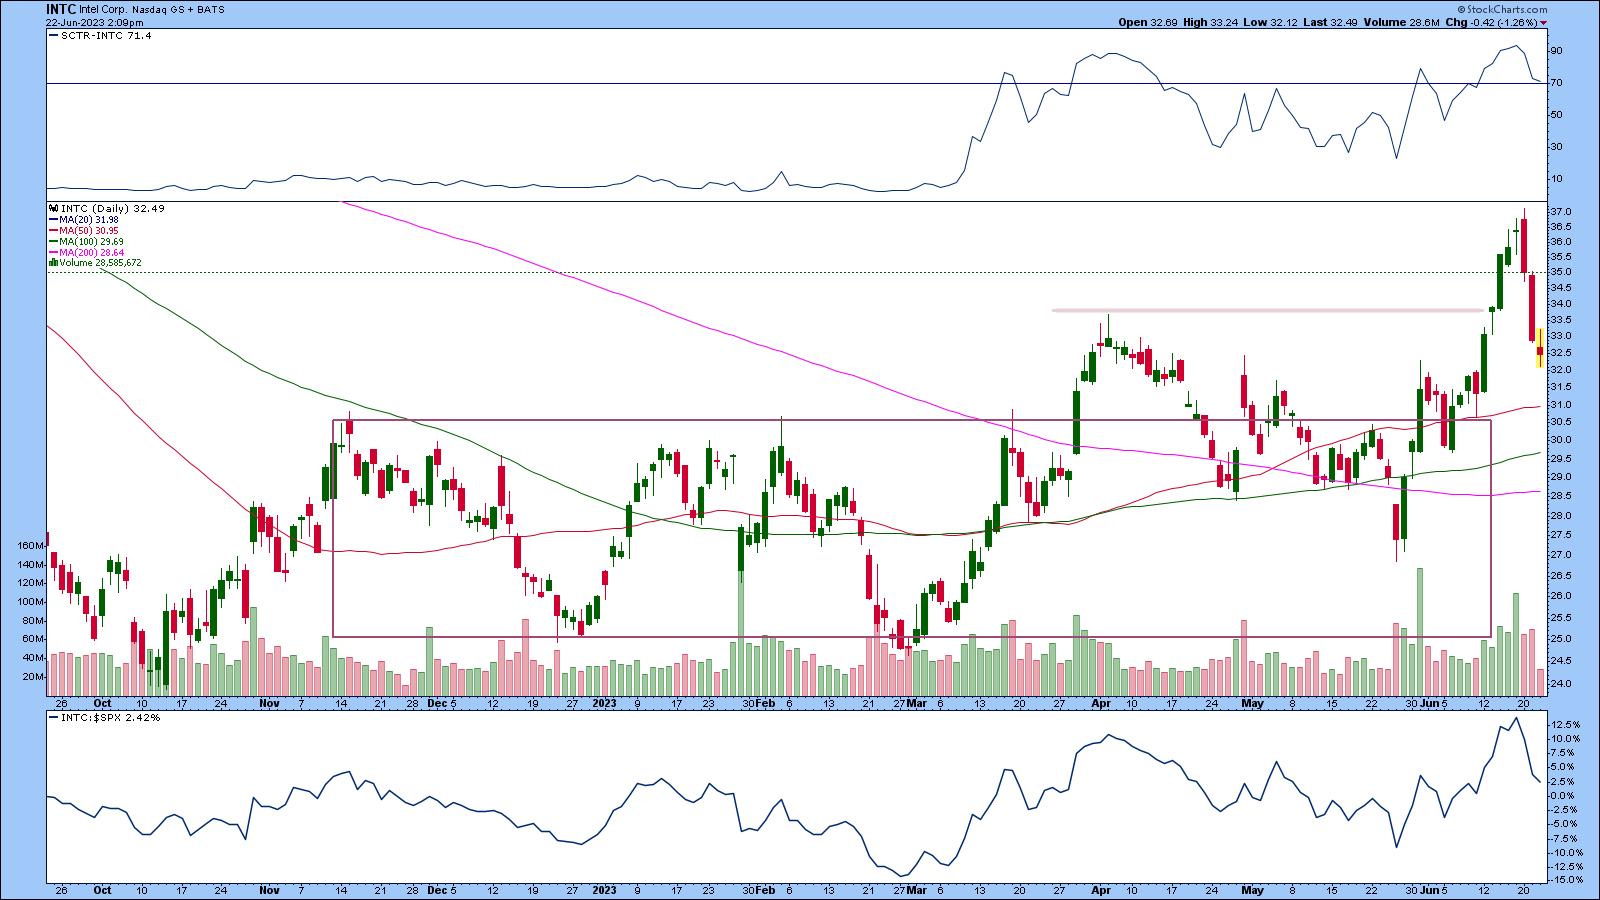
CHART 4: DAILY CHART OF INTC STOCK SHOWS MAJOR PULLBACK. Will INTC reverse back to the upside?Chart source: StockCharts.com (click on chart for live version). For educational purposes only.
INTC stock broke out above $35 and moved higher on strong volume. The stock has pulled back, but has fallen below $35. SCTR is still barely hanging on to the 70 level. Relative strength with respect to the S&P 500 index ($SPX) has fallen and is barely in positive territory. Intel's stock price is now heading lower toward its 50-day SMA, which could be a support level. Any lower than that and the stock may be back to its pre-breakout trading range. It's still worth watching the stock and analyzing a chart of INTC vs. the VanEck Vectors Semiconductor ETF (see chart below).
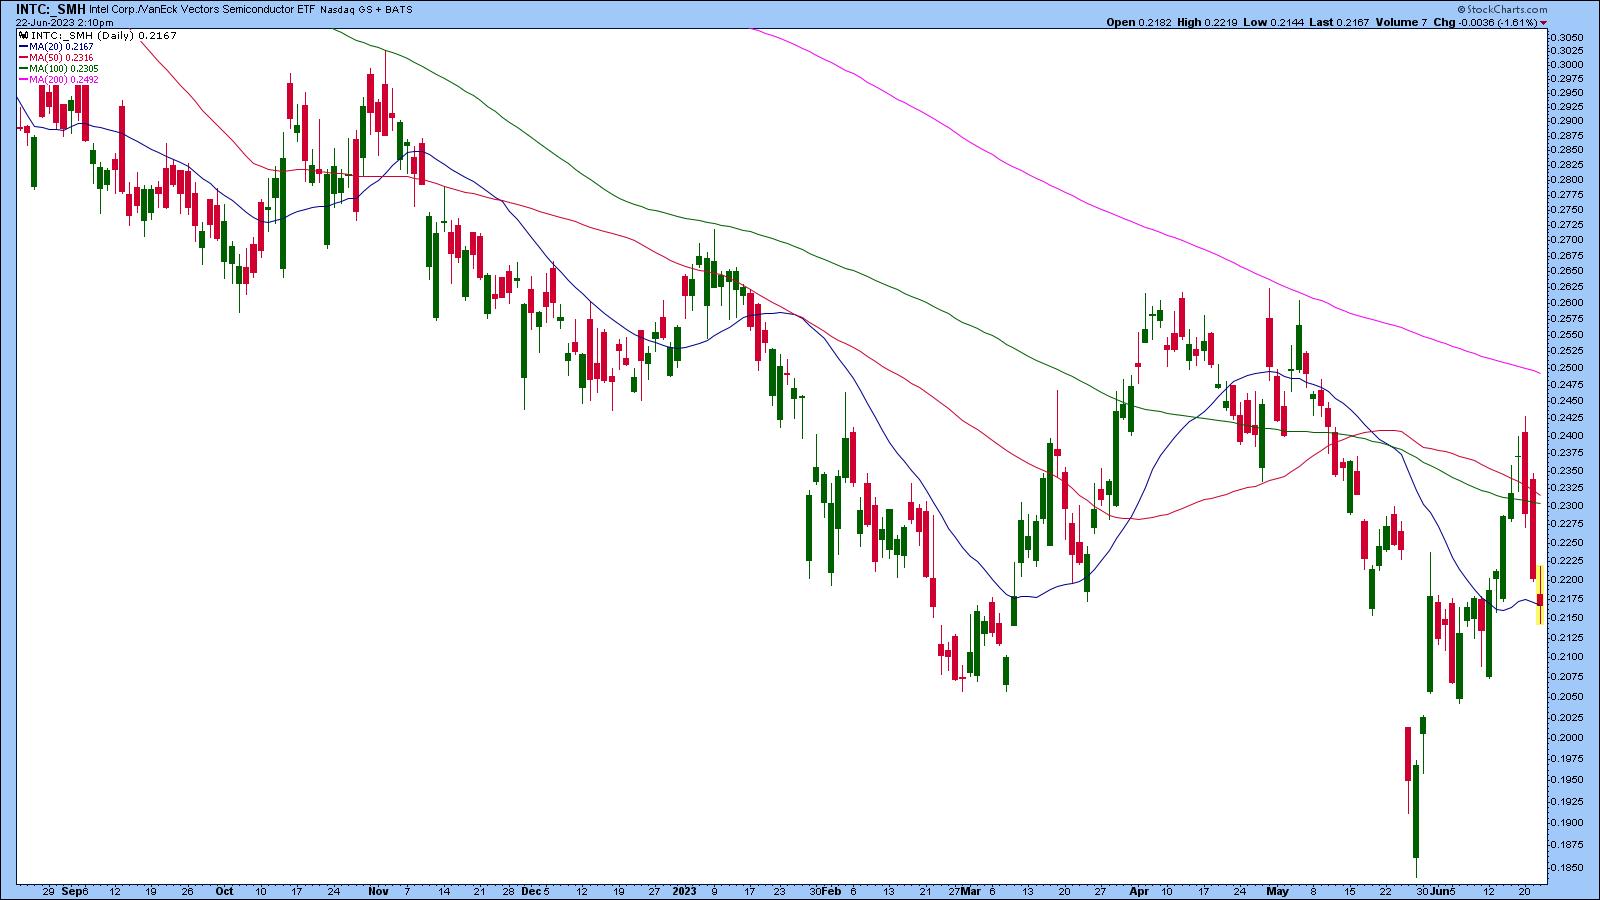
CHART 5: INTC VS. SMH. INTC is underperforming the semiconductor subsector. Will it catch up with them? It depends on its future investments in the AI space.Chart source: StockCharts.com (click on chart for live version). For educational purposes only.
INTC may be one of the laggards in the semiconductor space. But that doesn't mean it should be avoided. If INTC succeeds in being a part of the AI boom, it could become a stronger player.

Disclaimer: This blog is for educational purposes only and should not be construed as financial advice. The ideas and strategies should never be used without first assessing your own personal and financial situation, or without consulting a financial professional.
Happy charting!
