If you missed the AI run, this could be an opportunity to jump into a related stock, which surprised when it showed up in the StockCharts Technical Ranking (SCTR) scan on June 13.
Intel Corp. (INTC) is a stock that could have some upside potential. Like most stocks in the Tech sector, INTC had its share of woes in 2022. While semiconductor stocks such as Nvidia (NVDA), Marvell Technology (MRVL), and Broadcom (AVGO) rallied strongly, INTC has been the laggard, struggling to follow along. But a strategic move by Intel may give the stock price a boost.
There's a chance that INTC may be an anchor investor for Arm Holdings' upcoming IPO. Why does this matter? Arm designs cutting-edge chips that are used by companies such as Apple (AAPL), Samsung, and Amazon (AMZN). Investing in Arm opens the door for INTC to join the AI boom. Given this development, it may be worth adding INTC to one of your ChartLists.
Zeroing In: Daily Price Action in Intel
INTC is trading above its 50-, 100-, and 200-day moving averages (see chart below). As long as the stock remains above the trading range it was stuck in for a few months and breaks above its April high, which it's flirting with, the stock could have upside potential.
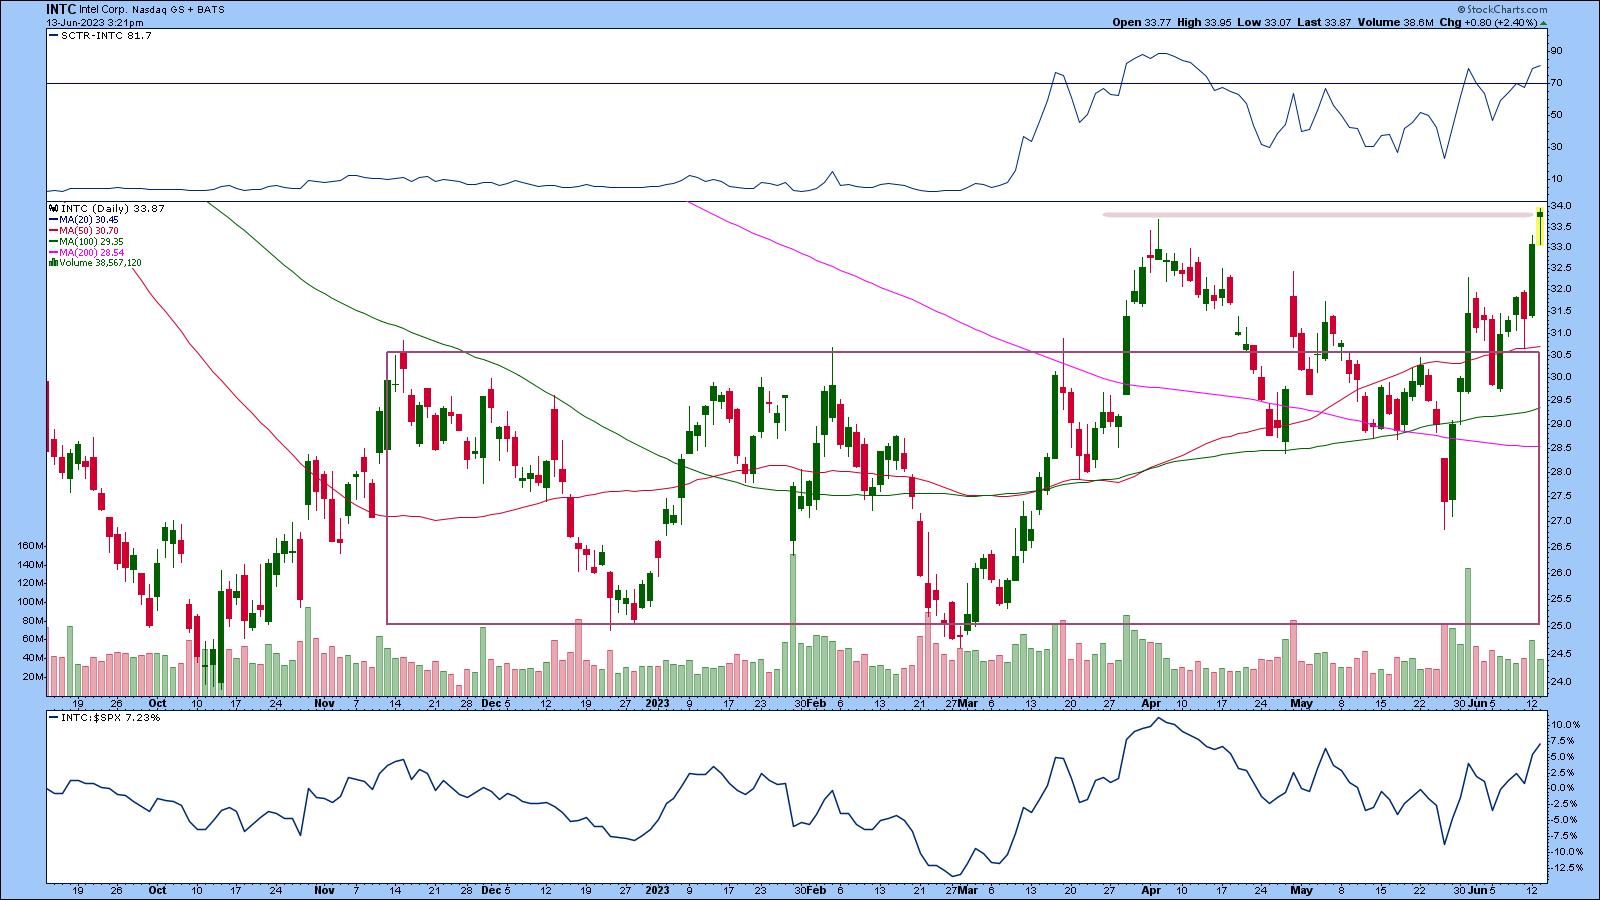
CHART 1: DAILY CHART OF INTC. After a long struggle, INTC may catch up to its semiconductor peers, as it may have a path toward joining the AI boom.Chart source: StockCharts.com (click chart for live version). For educational purposes only.
The SCTR score crossed the 70 level, but it has done that before and the stock price wasn't able to follow through on the rally. Instead, price moved back within the trading range. Will SCTR stay above 70 this time? That remains to be seen.
Relative strength with respect to the S&P 500 index ($SPX) is weak, but is in positive territory and moving higher.
A Weekly Perspective
Looking at the weekly chart of INTC, a completed triple bottom has formed (see chart below). The stock price broke above the triple top on March 27 (hint: check the Inspect box located above the chart on the left side) on relatively high volume.
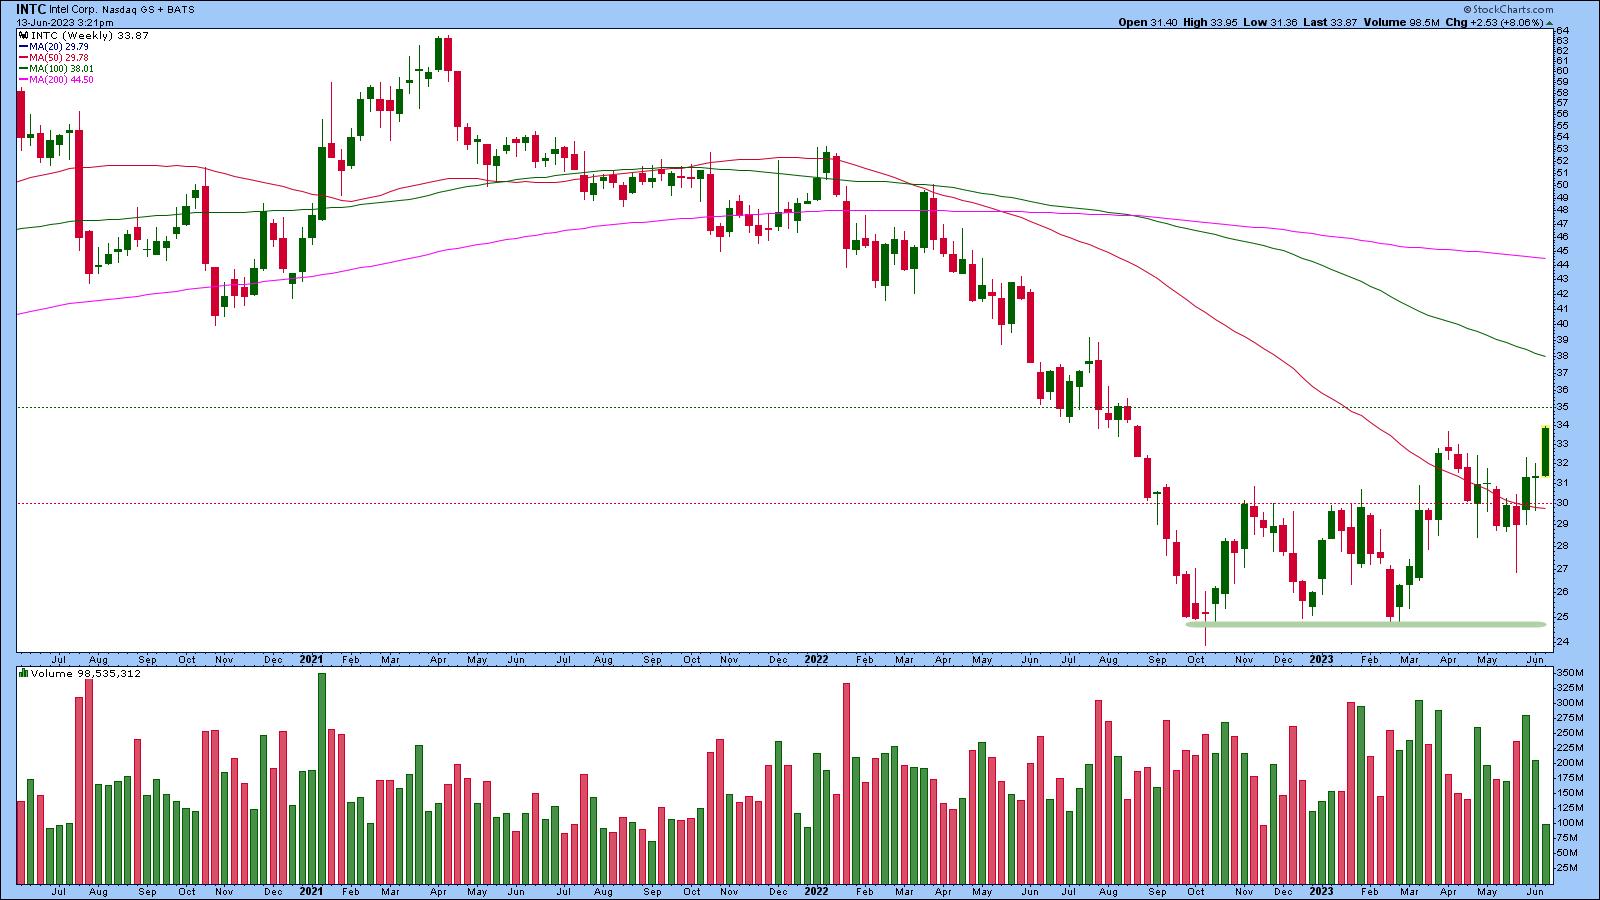
CHART 2: TRIPLE BOTTOM IN THE WEEKLY CHART OF INTC. A move above the breakout measured move price target could be a valid entry point.Chart source: StockCharts.com. For educational purposes only.
Tip: You can use the Inspect tool in SharpCharts to measure the height of the triple bottom to anticipate how much higher the stock's price will likely move. Place your cursor at the bottom of the pattern and drag it to the top of the two peaks, which is at around $30 (red dashed horizontal line).
In the case of INTC, the measured move is $5. That means price would move at least $5 from the breakout point of $30 or to at least $35 (green dashed horizontal line).
On March 27, when price broke above the triple bottom pattern, it didn't quite reach the $35—it pulled back and dipped below the $30 breakout point. It's attempting to break above the $30 level again. Will it reach $35 this time? It could, but the price action after it reaches $35 is more important.
How to Trade Intel Stock
- The first hurdle for INTC is to break above its April high. Once it does, look for a move above $35. If it happens with above-average volume, there's a strong chance INTC will rally higher. In triple bottoms, generally, when price reaches the measured move price target, there's a pullback. Price action after the pullback is important. How the price action during the pullback unfolds will provide clues as to how likely price is to rally.
- If price pulls back after reaching $35 and continues moving higher on above-average volume, it would be a good entry point signal.
- The first resistance level would be the 100-week MA. If price continues higher with momentum, there's no need to exit the trade. Hopefully, by then, the 100-week MA turns upward. If price continues higher, you could set a trailing stop and take profits on partial positions.
- Keep an eye on the SCTR and relative strength on the daily chart. A SCTR > 70 means the stock is still worth holding. If the stock's strength relative to the S&P 500 gets stronger, this stock could be a solid trade.
Other Stocks From the Scan
Here are some of the other stocks that showed up on the large-cap SCTR scan. Do you detect any industry trends?
Baidu, Inc. (BIDU)
Cardinal Health Inc. (CAH)
Caterpillar, Inc. (CAT)
Microchip Technology, Inc. (MCHP)
NXP Semiconductor N.V. (NXPI)
Toyota Motor Corp. (TM)
Looking Back at Zillow
On June 6, Zillow Group, Inc. (ZG) was the featured SCTR scan stock. Let's look at how that stock is performing.
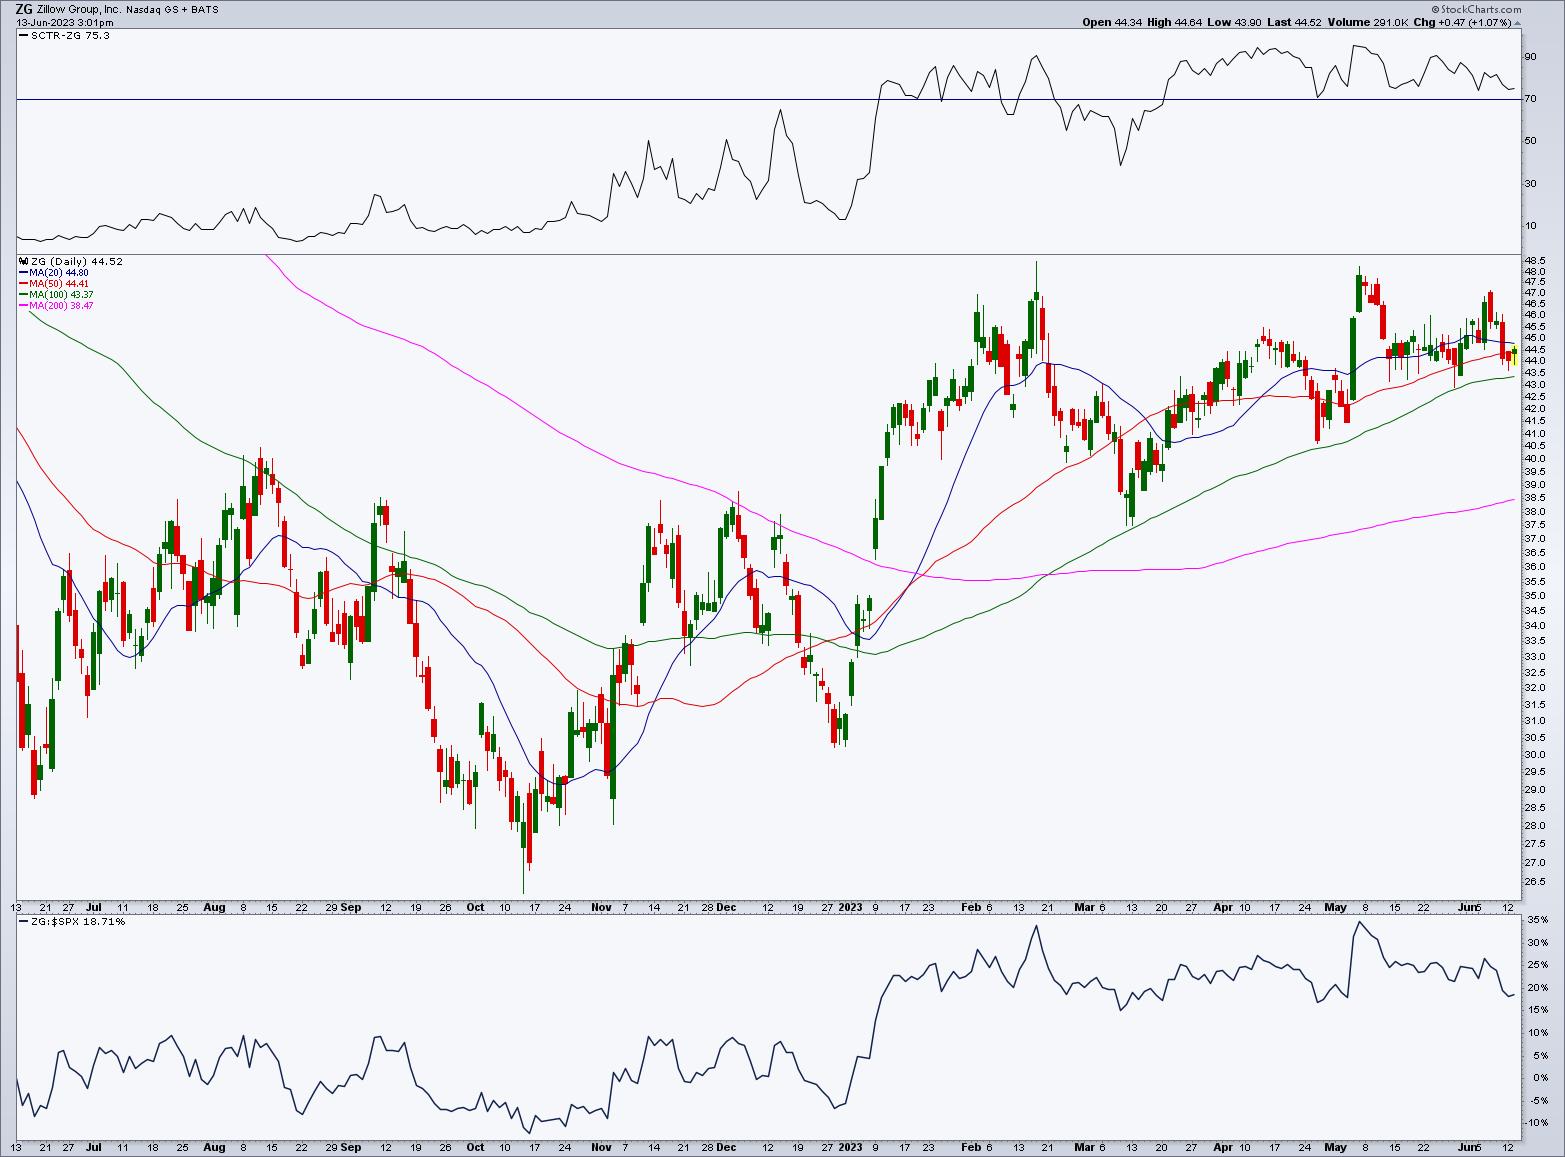
CHART 3: DAILY CHART OF ZILLOW GROUP (ZG). The stock price didn't reach the $48 entry point, which means no trade.Chart source: StockCharts.com (click chart for live version). For educational purposes only.
SCTR is moving lower, but is still above 70. Relative strength with respect to the S&P 500 index ($SPX) has fallen, but is still in positive territory. The stock price didn't reach the $48 level, so no trade should have been made. Does it mean you should delete this stock from your ChartList? You could until it shows up in the scan result later. The stock is pulling back, and there's a chance it could make another run for the $48 level.
SCTR Crossing Scan
[country is US] and [sma(20,volume) > 100000] and [[SCTR.large x 76] or [SCTR.large x 78] or [SCTR.large x80]]
Credit goes to Greg Schnell, CMT, MFTA.

Disclaimer: This blog is for educational purposes only and should not be construed as financial advice. The ideas and strategies should never be used without first assessing your own personal and financial situation, or without consulting a financial professional.
Happy charting!


