The Relative Rotation Graph with the Dow Jones Industrials stocks once again shows some interesting moves. There are a few long tails that catch my attention for a quick inspection but in this article, I want to pay a closer look at some stocks with remarkably short tails. One of them being Apple Inc. (AAPL).
Summary
- DD continues positive rotation but runs into resistance
- MSFT and MCD keep on pushing, strongest stocks in the universe
- NKE losing relative momentum
- Short tails for TRV, KO, V and HD on right-hand side of RRG
- AAPL looks dangerous
RRG for $INDU
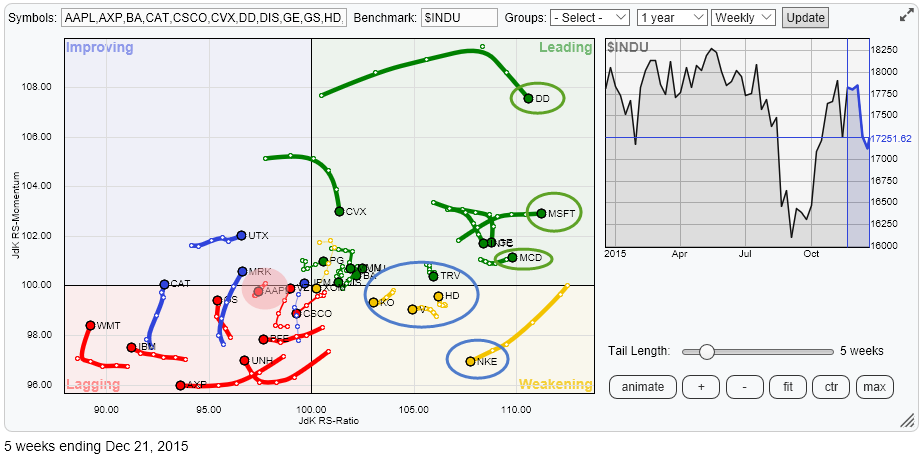
A first look at this Relative Rotation Graph holding the members of $INDU draws my attention primarily to the right-hand side of the graph.
Starting at the top DD is showing a nice follow-through into the leading quadrant after the previous article on $INDU stocks. The little dip in relative momentum is nothing to worry about (yet).
MSFT and MCD are looking healthy as they are still moving higher on the JdK RS-Ratio axis while keeping stable relative momentum, almost horizontal move on the JdK RS-Momentum scale.
Also, the long tail on NKE while pushing further into the weakening quadrant is attractive enough to inspect further.
As usual, the stocks with the long-tails grab the attention, especially when they move at or towards the edges of the RRG. The short tails, however, can also tell an interesting story. On the chart above the cluster on the right-hand side of the plot inside the blue oval (TRV, HD, V and KO) are worth a look and on the left-hand side AAPL is interesting as it is showing a very short tail while still inside the lagging quadrant.
DuPont Co. - DD
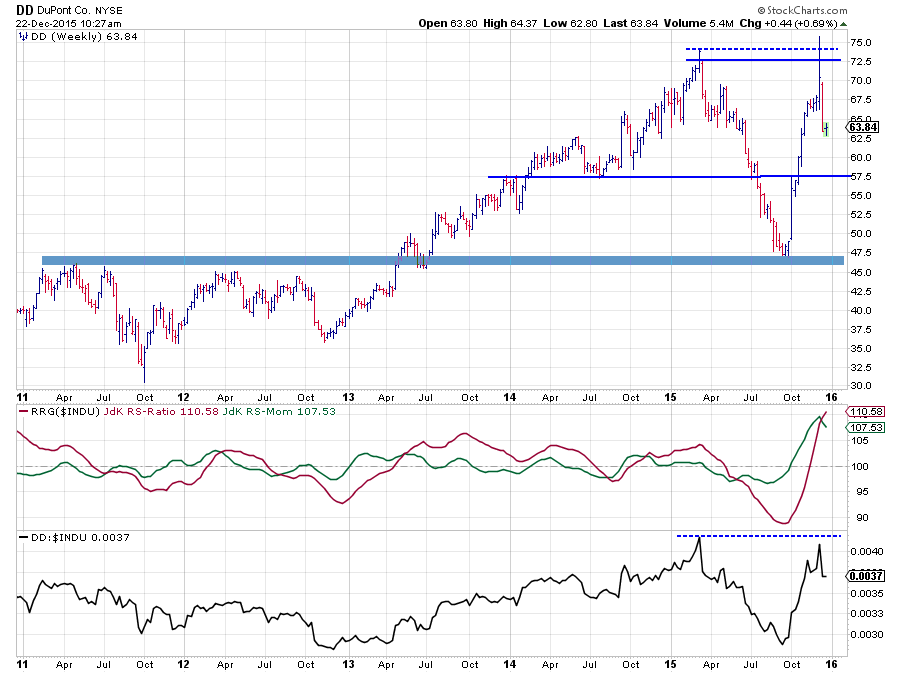
The almost vertical move of DD stalled against resistance offered by the peak that was set earlier this year near $ 74. Pretty much at the same time the raw RS-line peaked near the level of its previous major high. With the JdK RS-ratio line still at high levels, DD remains one of the stronger stocks inside the Dow Industrials.
As both the relative strength line and price have touched resistance, there is some downward risk for DD in the near term which means that better opportunities will probably arise at lower levels.
The first serious level of support is seen near $ 57.50.
Microsoft Corp. - MSFT
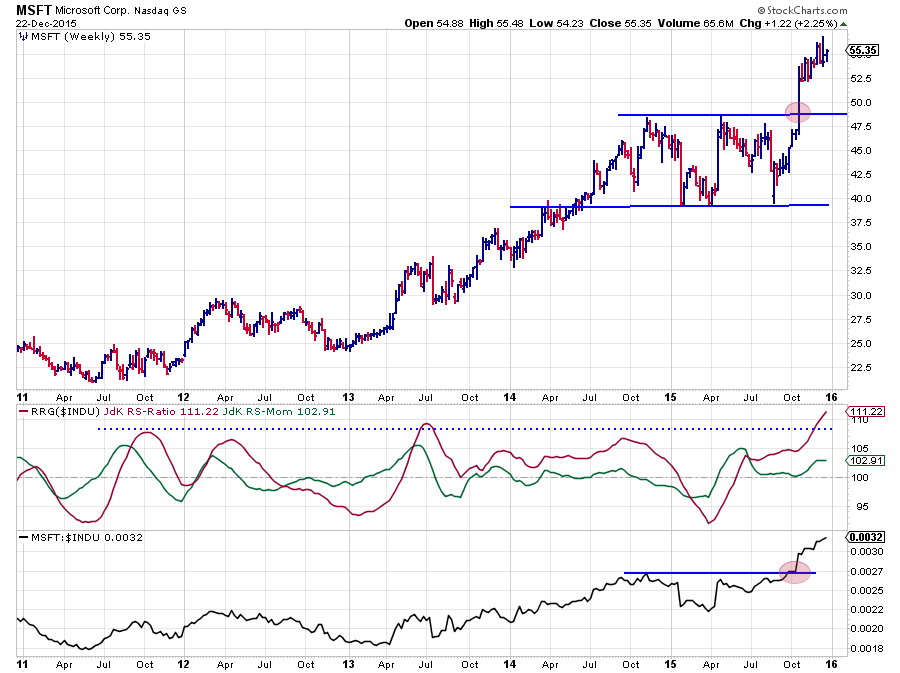
Microsoft is one of those stocks that did not seem to get hurt by general market weakness, or, at least, uncertainty, that we have experienced over the past few weeks.
After the break above the horizontal resistance near $ 49, mid-October MSFT continued to push higher, uninterrupted by some sort of setback. Pretty much the same picture is seen in the relative strength graphs. The raw RS-Line pushed beyond its recent peaks and continued strongly higher. This move translates in a JdK RS-Ratio line moving to 5-year highs backed by a JdK RS-Momentum line still above the 100-mark.
With the rally is well underway on both the price- and the relative-graphs it's probably better not to chase it anymore but for existing positions; "enjoy the ride."
McDondals Corp. - MCD
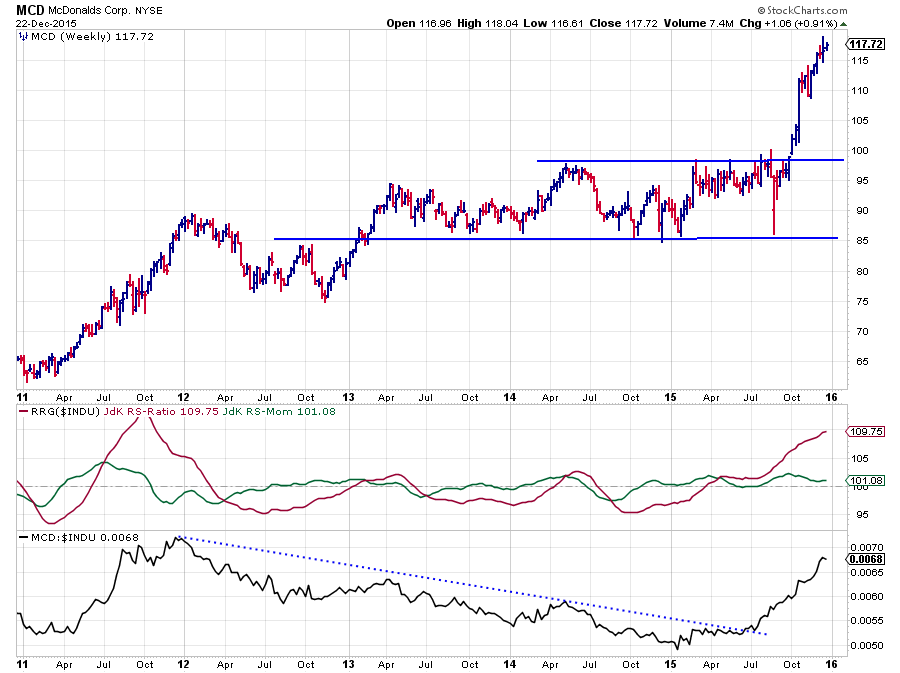
Just like MSFT, MCD is showing a very strong picture on both the price- and the relative charts.
The JdK RS-Ratio line of MCD already crossed above the 100-level back in March of this year, just before the raw RS-Line broke a three-year downtrend and well ahead of the important break above horizontal resistance on the price chart ($ 98-100 area).
Relative strength for MCD has been remarkably steady since March-April, and it is still looking excellent now. Just like the price chart that is showing almost no setback of any importance after the stock started to rally beyond $ 100.
From an investor's point of view, the rally is, well, underway so better not chase it but it seems to be too early to exit long positions for the time being.
NIKE Inc. - NKE
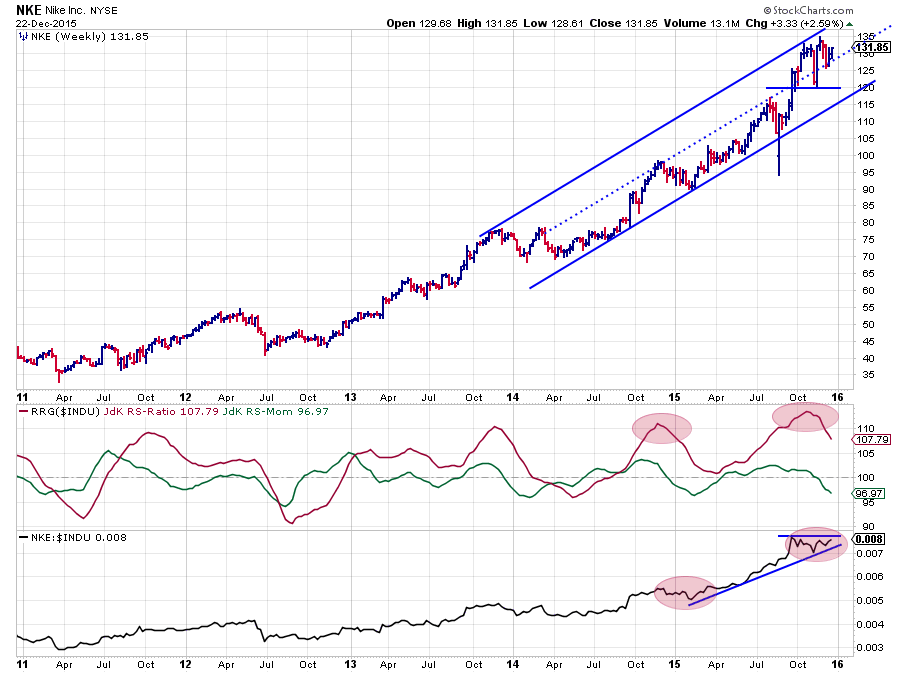
There is no doubt about it that Nike has been one of the strongest stocks inside the Dow over the past three years.
As you can see on the chart above the uptrend on the rice chart is still very much alive and in the upper half of the channel that can be drawn using the major highs and lows over the past two years. The relative charts, the RRG-Lines and the raw RS-Line, plotted below the price chart, are showing that relative strength over this period sometimes is getting ahead of itself and then needs to pause to recover before adding another leg up. At the moment, a similar situation seems to be unfolding as we have seen at the beginning of this year. The raw RS-Line starting to move flat causing the RS-Ratio to peak, around 110, and starting a setback led by a decline in relative momentum (JdK RS-Momentum). After the setback, during which RS-Ratio remained above the 100-level, the raw RS-line picked up again and pushed beyond its recent peak to continue its run up.
At the moment, we see raw-RS moving flat, and the RS-Ratio line has started to correct while still well above 100. In combination with RS-Momentum below 100, this puts NKE inside the weakening quadrant on the Relative Rotation Graph, heading lower on both axes.
We have to wait and see how this current (relative) weakness will unfold in coming weeks, but a break of the raw RS-Line above its recent high will very likely cause the end of the correction and pull the RRG-Line back up again and make NKE rotate back from weakening into the leading quadrant. Such a move will likely be a good moment to add to or re-enter long positions in order to profit from another move higher relative to $INDU.
What about short tails?
When looking at Relative Rotation Graphs the stocks, or sectors, showing long tails easily stand out, especially when they are moving at or towards the edges of the plot. And usually, these stocks are worth having a look at as they are on the move, at least from a relative point of view. Does that mean that stocks that are showing a short tail can immediately be ditched? The answer to that question is a definite NO.
Before moving on about the interpretation of short tails, we have to take a look at what sort of situation causes a short tail to show up on the Relative Rotation Graph. This happens when the week-on-week (or period-on-period) change in both the JdK RS-Ratio and JdK RS-momentum is showing little or no change. Visually this means that both lines are moving (almost) flat.
The next important thing to look at is at what levels of both the RS-Ratio and the RS-Momentum lines this is happening. For example, when RS-Ratio is well above the 100-level and RS-Momentum is moving flat it means that the security is in a relative uptrend (RS-Ratio is above 100), and it is continuing higher at the same speed. The level of the JdK RS-Momentum line indicates the speed at which the relative trend is unfolding, the higher the level of the RS-Momentum line the steeper the trend is moving. Naturally, the reverse goes when JdK RS-Ratio is below 100.
In short, securities showing short tails are very "stable" at their current position on the RRG. Only when such a short tail is showing up close to the center point of the chart, the benchmark, there is not much to gain from a relative point of view as the security will be moving in line with the benchmark.
Looking at the Relative Rotation Graph for the Dow stocks we can see a number of stocks showing short tails in comparison to the other stocks on the graph. The picture below is the same as the RRG at the top of the article, only showing stocks with short tails.
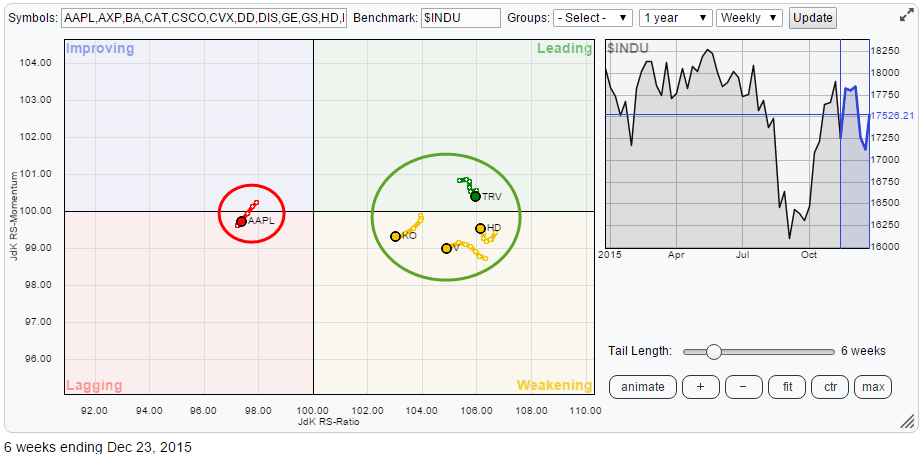
On the right-hand side, the positive side, of the plot we find four stocks clustered together all showing short tails over the past six weeks. These are TRV, HD, V and KO.
All these stocks are still in relative uptrends with RS-Ratio levels above 100. Their relative momentum is almost flat as they barely show any movement on the vertical (JdK RS-Momentum axis). Out of these four, I am most interested in having a closer look at HD as it has already started to turn back up, heading for the leading quadrant again. This is interesting as it could be signalling the end of a corrective move in the relative uptrend and, therefore, a renewed opportunity to get back on board.
On the left hand, negative, side of the RRG we find AAPL with a short tail over the last six weeks. And when AAPL asks for attention we will give AAPL attention.
Home Depot Inc. - HD
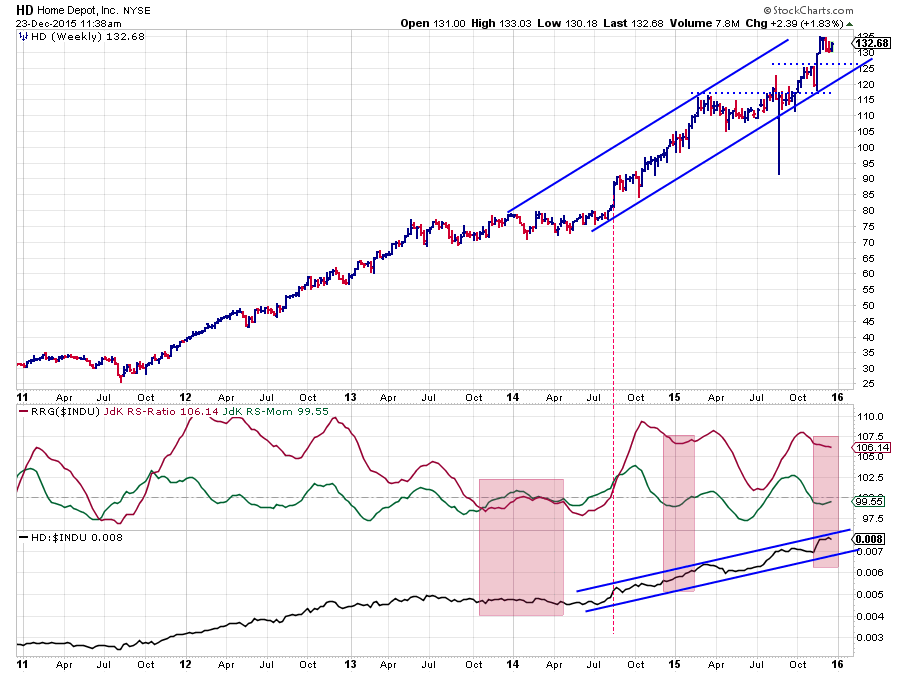
As pointed out above HD is the stock, out of the four showing short tails with RS-Ratio > 100, in which I was most interested. The reason for this is that the tail already started to point up again. On the chart above this can be seen in more detail as the green RS-Momentum line has just begun to move higher again while the RS-Ratio line is almost flat at a high level near 106.
A similar situation happened back when 2014 changed into 2015. The RS-Ratio line was flat at a high level, around 106-107 just like today, and the RS-Momentum line moved more or less horizontal slightly below 100. During that period relative strength gradually but steadily moved higher, just like what we see at the moment.
During the last few months of 2013 up to April-May of 2014 we can also find a period with a very short tail for HD, only this time both the RRG-Lines are moving close to the benchmark signalling that there is no meaningful relative trend (RS-Ratio close to 100). The raw RS-line moves almost flat during this whole period.
For now, things still look good for HD as the uptrend on the price chart as well as on the relative charts is still fully intact. When the JdK RS-Momentum line crosses back above 100, a continuation of the relative uptrend and a rotation into the leading quadrant may be expected.
Apple Inc. - AAPL
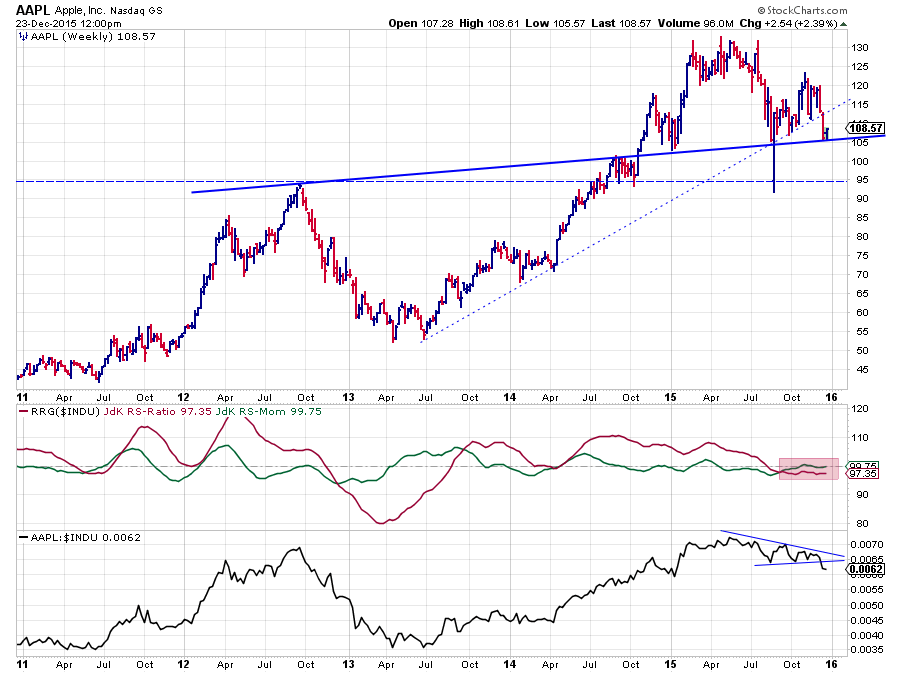
After setting three peaks just above $ 130 in the first half of this year AAPL started to deteriorate on both the price and the relative graphs.
On the price chart, the first sign was the drop below support around $ 120, followed by a dip to $120. This weakness was then confirmed when the recovery rally peaked around $ 120 where old support started to act as resistance. During this process, two rising support lines (thin dashed on the chart) got violated.
At the moment, AAPL is hovering above support near $ 105, and we could see a Head and Shoulders top formation in the making. The final confirmation for this reversal pattern will be triggered when the neckline gives way. At that moment, a price target, based on the height H&S formation, can be calculated around $ 80.
From a relative point of view, things do not look much better. Over the past few months, the raw RS-Line started to move in a triangle like pattern, out of which we are now seeing a downward break, signalling an acceleration of the relative down-move.
The RS-Ratio line dropped below 100 in August but never actually pushed further down. With both RRG-Lines close to 100 the performance of AAPL was in line with the benchmark ($INDU). The break, out of the triangle on the relative strength line, suggests that this is about to change. RS-momentum is likely to start moving lower now, pushing AAPL into a relative downtrend against $INDU.
Merry Christmas!
From a relatively warm (double digit -Celcius- temperatures) Amsterdam, I would like to wish all of you a very Merry Christmas and happy holidays.
Julius de Kempenaer | RRG research
RRG, Relative Rotation Graphs, JdK RS-Ratio and JdK RS-Momentum are registered TradeMarks by RRG research.


