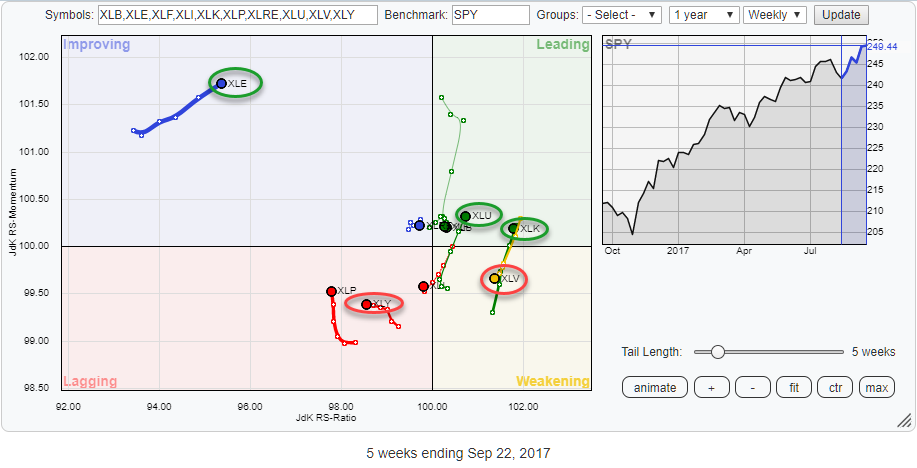
 The Relative Rotation Graph above holds the ten sector SPDR ETFs that make up the complete S&P 500 index (SPY).
At the moment the positioning of the various sectors and their rotational patterns are relatively evenly spread over the RRG canvas except for XLE which is far away from the center of the chart inside the improving quadrant.
The Utilities (XLU) sector, which I looked at more in depth in my previous blog, continues to do well and push further into the leading quadrant.
And finally, Technology (XLK) and Health Care (XLV) continue their almost perfect opposite rotational pattern, worth a further inspection.
Summary
- XLE continues at positive RRG-Heading inside improving quadrant
- XLU pushing further into leading quadrant
- Pace dropping for XLK
- XLV shrugging off relative downtrend
- XLV / XLK offering (aggressive) pair trade opportunity
- XLY rotating deeper into lagging
- Potentially rare rotational pattern coming up in XLI (positive)
Zooming in
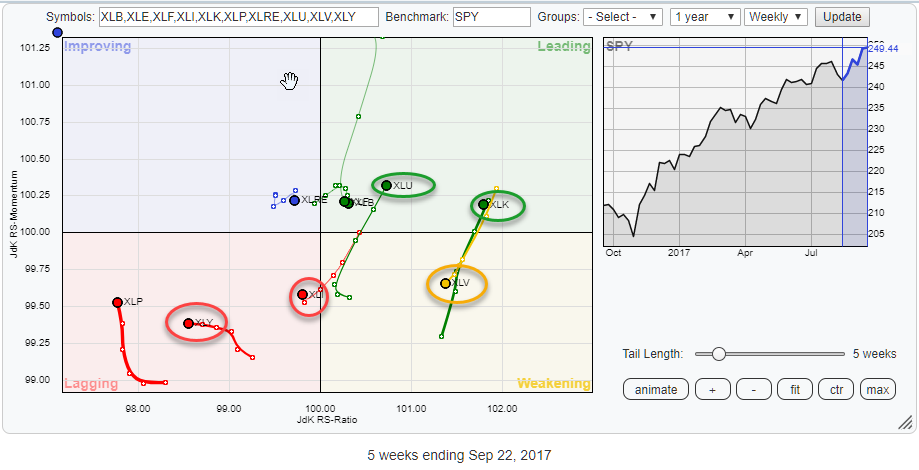 Above is the zoomed in Relative Rotation Graph which shows the rotation of the various sector in more detail.
The acceleration of XLU into the leading quadrant is now better visible. Note the increasing distances between the last few weekly observations. XLK is the other sector that is pushing into the leading quadrant at a positive RRG-Heading but seems to stall at the moment.
This (stalling) also seems to be the case for XLV which is rotating through the weakening quadrant at the moment, the past three weeks XLV only moving slightly lower and seems to be losing its downward momentum.
Two other rotations that get a bit more pronounced in this zoomed in picture are XLY, now moving more clearly lower on the JdK RS-Ratio scale, and XLI that just crossed over into lagging but immediately seems to move higher on the JdK RS-Momentum axis.
Energy - XLE
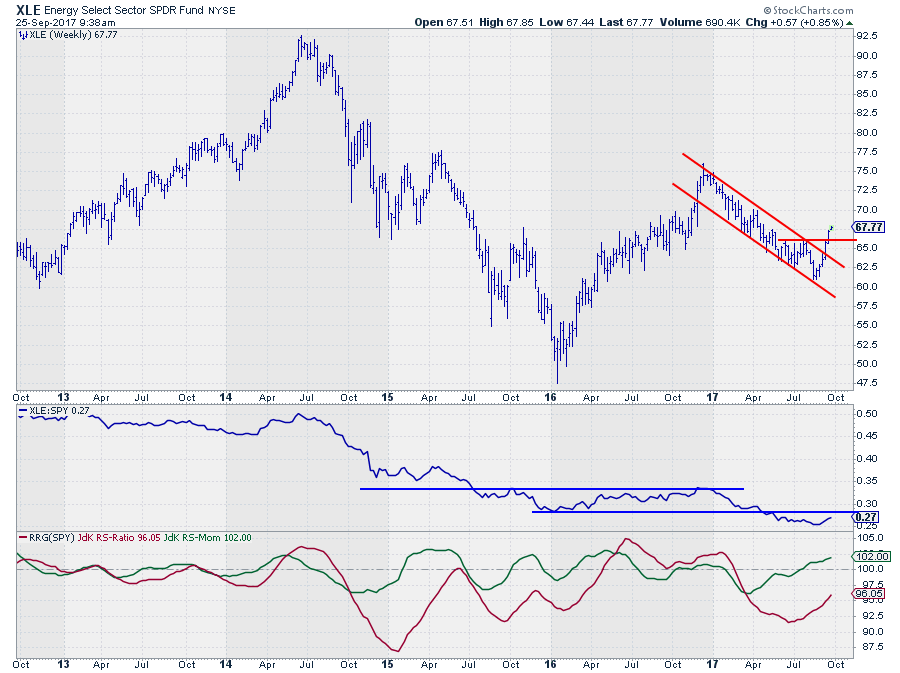
The improvement on the price chart of XLE is clearly visible. Over the past five weeks, XLE rallied from a low near $ 60 to almost $ 68 currently. In this process, the falling channel was convincingly broken, and the previous high has been taken out.
Although this means that the series of lower highs and lower lows (i.e., the downtrend) was broken, it does not automatically make it a new uptrend. For that to happen, a new, higher, low has to be set above $ 60. The higher, the better.
The relative picture is not as good yet as what we see in price, but the improvement is there. The raw RS-line is moving higher but has a tough hurdle to take around the levels of the previous lows. Once that barrier can be taken out, the relative picture will improve rapidly.
The RRG-Lines are anticipating with a RS-Momentum line already above 100 and rising which is pulling the RS-Ratio line from its low. There is still some distance to cover before XLE hits the leading quadrant, but for the moment things are starting to improve for energy stocks inside the S&P 500.
Utilities - XLU
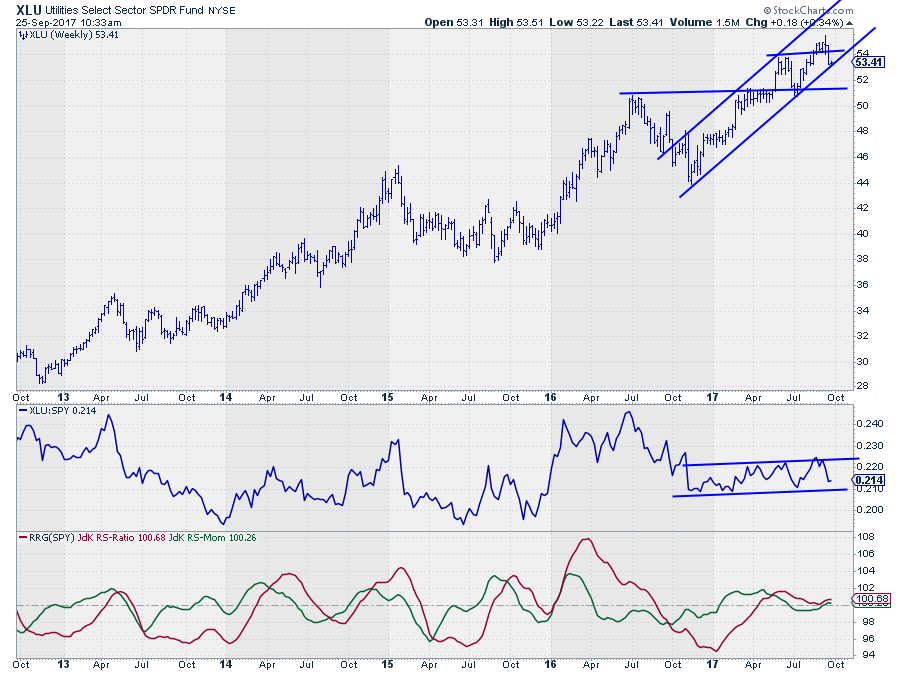
Utilities were covered more in-depth in my previous blog. On a sector level, the price of XLU dropped back below its breakout level and is now resting at support offered by the rising trendline. Falling back below a breakout level is not the strongest of signs, but the trend is still intact.
From a relative perspective, the RS-Line set a new high and dropped back within the boundaries of the trading range. This sideways movement is reflected in the chart holding the RRG-Lines where we find both the JdK RS-ratio - and JdK RS-Momentum lines very close to the 100-level.
The good thing is that both are slowly moving higher which is pushing the Utilities sector further into the leading quadrant, making it one of the stronger sectors at the moment.
Technology - XLK
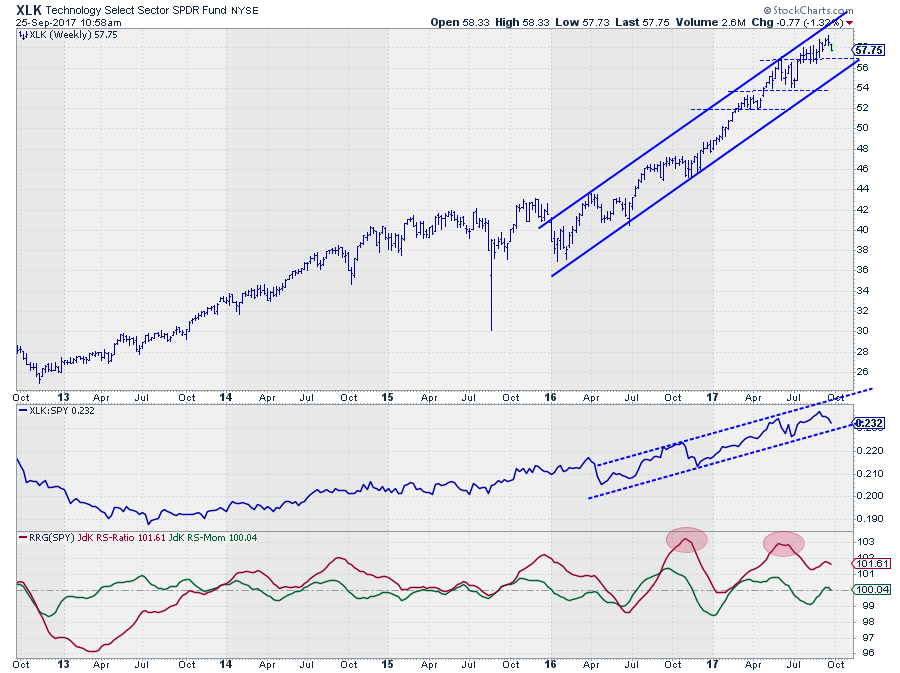
Technology continues its uptrend and is still moving higher within the boundaries of the rising trend channel. There is enough room within that uptrend for XLK to breathe / correct, without hampering the current positive picture.
More or less the same development is visible on the relative strength chart where the raw RS-Line is still making new highs within its rising channel. The only minor sign of potential weakness that is visible now is the fact that the most recent rally was much shorter than before and the rally did not manage to reach the top of the channel anymore.
This minor lack of upward power is now also visible in the behavior of the RRG-Lines where RS-Momentum just barely managed to push above 100 and has already started to roll over again. This can potentially cause the technology sector to turn back towards the weakening quadrant again.
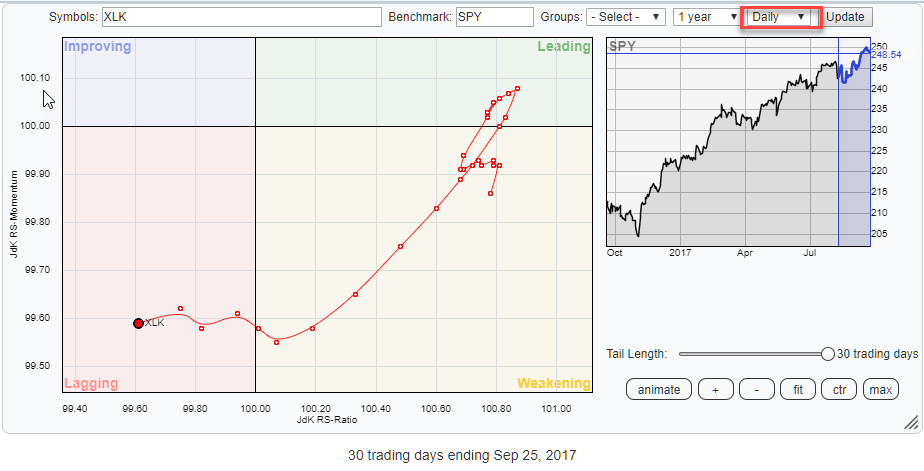
A quick look at the daily RRG for XLK against SPY reveals a weak rotation over the past few weeks which has already pushed XLK into the weakening quadrant at this shorter time-frame.
I'll take this as a warning signal for XLK in coming weeks with limited relative upside at best.
Health Care - XLV
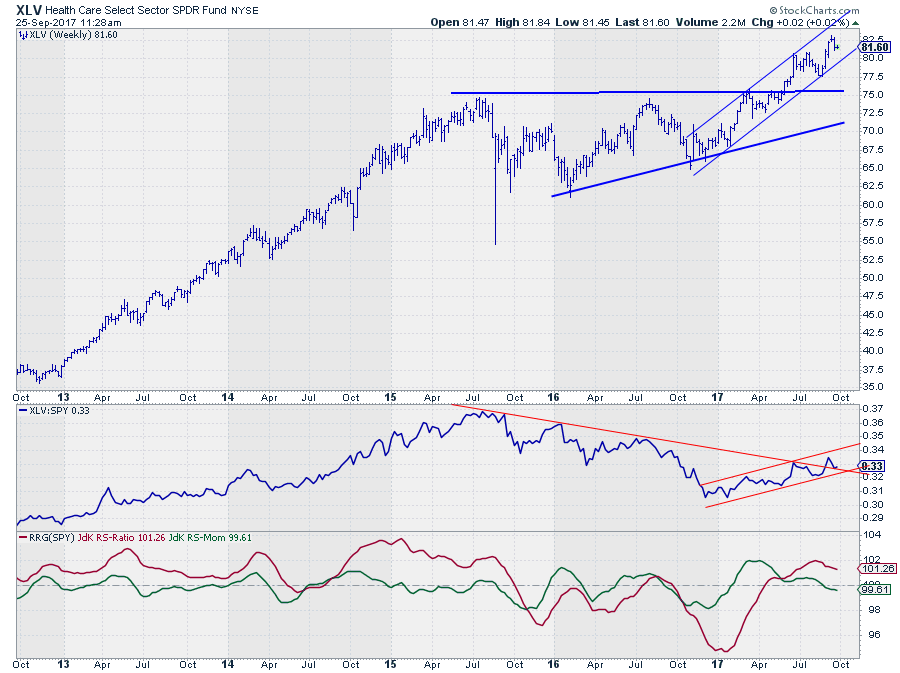
The Health Care sector, over the past months, has moved almost exactly opposite to Technology. And as described above for technology seeming to stall its upward relative move at least for the moment the same things seem to be happening for health care in reverse.
On the price chart, XLV broke above horizontal resistance at the beginning of this year and continued nicely higher within the boundaries of a newly formed rising channel. Just like XLK, XLV has enough room to maneuver without immediately breaking the trend.
The relative chart of XLV looks entirely different from XLK's. A few weeks ago XLV managed to take out the falling resistance line connecting the peaks since mid-2015. And, as we speak, that former resistance line is now being tested as a new support level.
The RRG-Lines responded by moving above 100 in early April after which RS-Momentum crossed back below that mark a few weeks ago.
If the RS-Line can hold up above current levels and continue to work its way higher within the newly established rising channel, there is s good opportunity for RS-Momentum to curl back up and cause XLV to rotate back above 100 and bring the sector back in the leading quadrant.
XLV - XLK pair
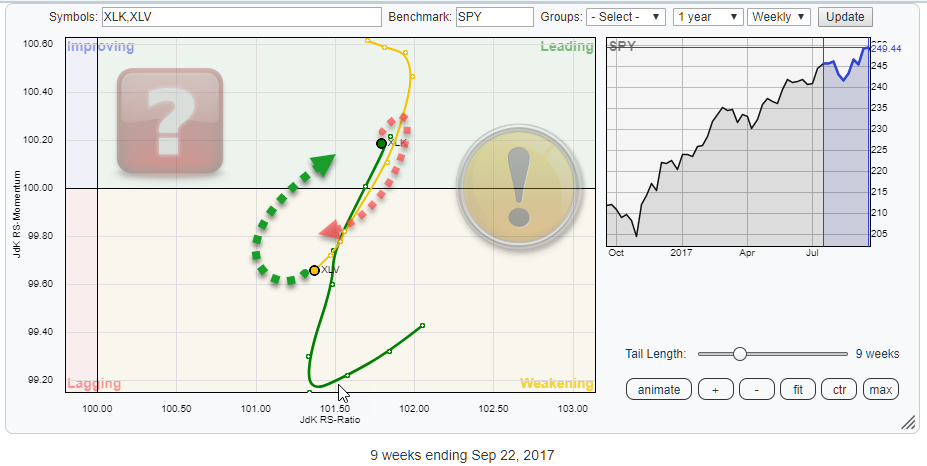
Based on the rotations of XLK and XLV a very aggressive trade can be seen by pairing XLV (long) against XLK (short).
Both are still doing well against SPY based on their positive RS-Ratio readings, but from a momentum point of view, XLV can be expected to turn back up while XLK will start to move down.
Consumer Discretionary - XLY
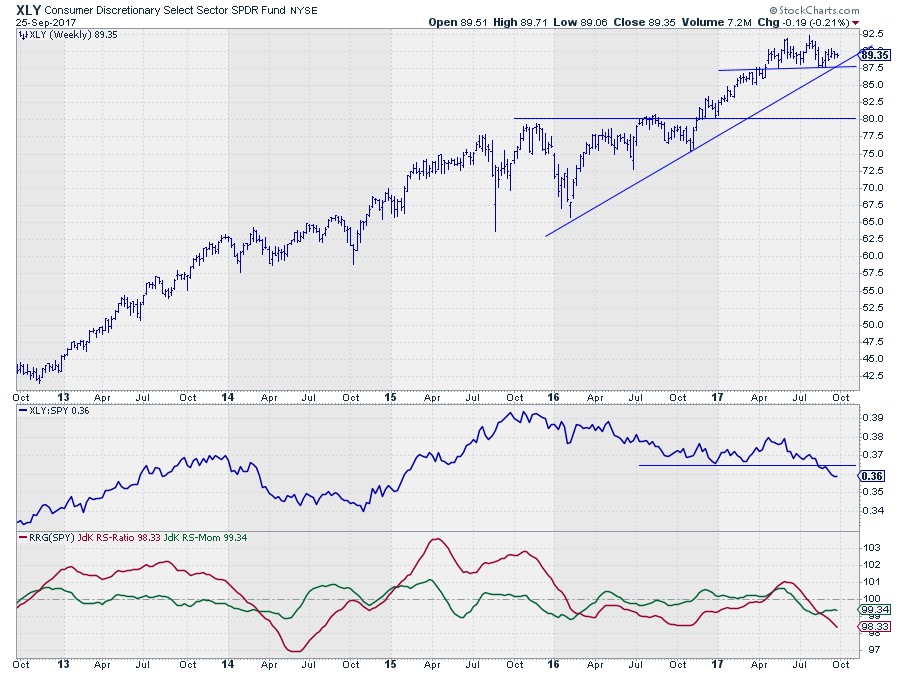
The Consumer Discretionary sector moved into the lagging quadrant at the end of July and moved lower on the RS-Ratio scale since then with relative momentum hovering around the same level.
The little pickup in RS-Momentum has caused the tail to curl a bit upward recently but that revival seems to have reached its shelf-life already, and XLY is starting to move further into the lagging quadrant again.
The RS-Line itself is sending a weak signal after breaking below that horizontal support level a few weeks ago, and there are no signs of an immediate recovery there.
On the price chart, XLY is still above horizontal support near $ 87.50 but on the last two rallies did not manage to take out the high near $ 92.50. The second attempt already stalled at $ 90, potentially making it the first lower high.
The combined support from the rising support line and the horizontal level near $ 87.50 will probably be crucial in coming weeks. A break lower will very likely cause an acceleration lower in price which will harm the relative picture even more.
Industrials - XLI
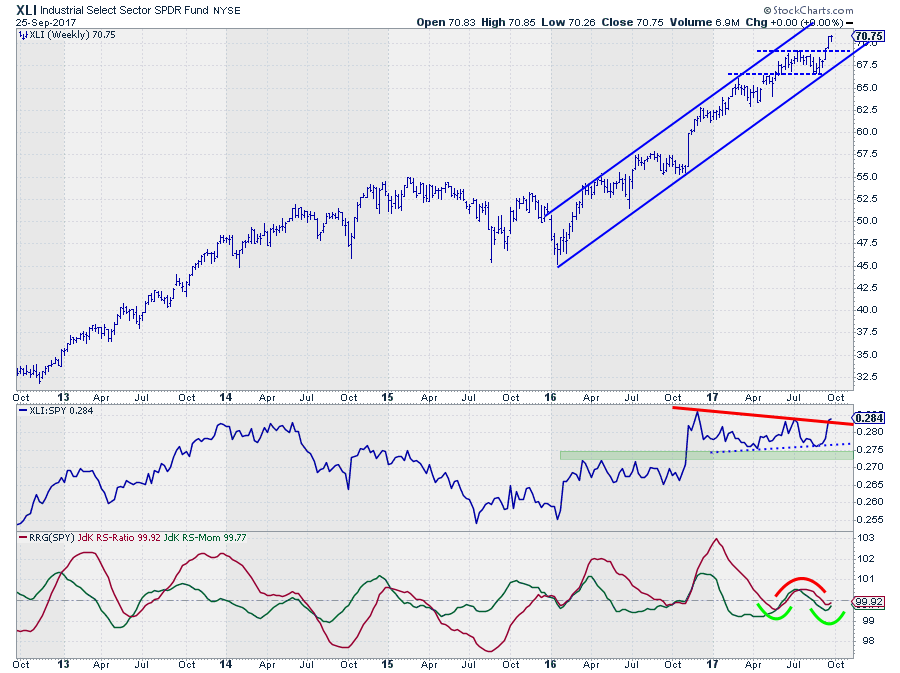
Industrials are currently rotating through the lagging quadrant but immediately after crossing over from weakening the sector picked up positive RS-Momentum and turned sharply up.
The RS-Line seems to be close to breaking above resistance which will unlock more upside potential which will surely pull the RRG-Lines above 100 again. The rise of relative strength of its support level was rapid, and the RRG-Lines need a bit of time to adjust.
This type of hovering around the 100-mark is typical when the RS-Line itself moves in a trading range.
The position of XLI on the Relative Rotation Graph in combination with the improvements that are visible in the price- and relative charts make this a very interesting sector to keep an eye on. Because both RRG-Lines are so close to the 100-mark, there is a decent chance that they will both "jump" above 100 at the same time. This will cause XLI to rotate from the lagging quadrant into the leading quadrant from one week to another.
Such a rotation is very rare. It happened only eight times in the past ten years across all sectors. BUT, all eight occurrences led to a positive result in the twelve weeks following the move averaging around 6% return. So definitely something to keep an eye on!
If you like to receive a notification anytime, a new article is posted in this RRG blog, please leave your email address and press the green "Notify Me!" button below this article.
Julius de Kempenaer | RRG Research
RRG, Relative Rotation Graphs, JdK RS-Ratio, and JdK RS-Momentum are registered TradeMarks by RRG Research
Follow RRG Research on social media:
If you want to discuss RRG with me on SCAN, please use my handle Julius_RRG so that I will get a notification

