
Happy New Year to our readers and our best wishes for 2015.
The recent buzz over a potential Greek exit from the Eurozone (GREXIT) has only confirmed our several recent contributions advocating prospective Dollar strength over the next few months and quarters. Indeed, EUR/USD has fallen almost 8 figures over the last month. Although we maintain our longer term bullishness on the Dollar vs the Euro and other currencies, this recent move does have a sense of a bit too quickly and a bit too far.
Considering the recent move, much of it can be attributed to EUR centric issues, i.e. the anticipation of a round of Quantitative Easing in Europe and more recently GREXIT. As it happens,
• The ECB presented today a EUR 500 bn Quantitative Easing plan, which although sizeable is at the lower end of expectations.
• In European politics, the Greek-German clash over potential Greek debt write-offs and the consequent German vow to force Greece out of the Eurozone if it were to happen (GREXIT), is showing signs of settling down and the debate seems to be evolving towards negotiation tactics rather than unilateral decisions.
[Quick recap: Mr Tsipras, head of left wing opposition anti-austerity Syriza party (who would be ready to let Greece default and is ahead in the January 25th election polls) has recently toned down his anti-European rhetoric, i.e. his party’s advance is narrowing and recent polls show that 3 out of 4 Greeks would want to remain in the Eurozone at any price. On the other hand, Mrs Merkel GREXIT remarks have been deemed irresponsible by many European politicians, she is now insisting that she wants Greece to remain in the Eurozone.]
Bluntly put, there might be a case here for “Sell the rumours, Buy the news”, especially that the EUR vs other major currencies is showing some signs of downside exhaustion.
EUR vs other major currencies on this FinGraphs’ Daily Mosaic:
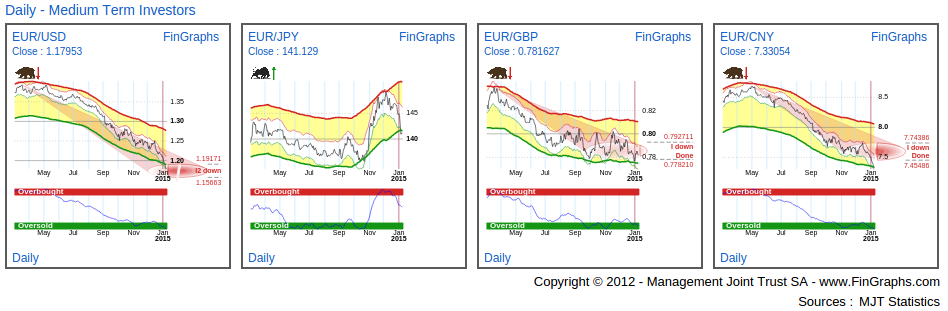
• EUR/USD is approaching its Impulsive 2 targets down (i.e. a very extended move).
• EUR/JPY is in a situation of downside stress (both envelopes are touching each other: a sign of exaggeration) and is still “slightly” Bullish (i.e. no targets: close to neutral, but still bullish)
• Finally, EUR/GBP and EUR/CNY (Chinese Yuan) have reached Impulsive targets down
Let’s try to take a closer look at the GREXIT effect:
Selected 10Y benchmark Bond Yields on this FinGraphs’ Daily Mosaic:
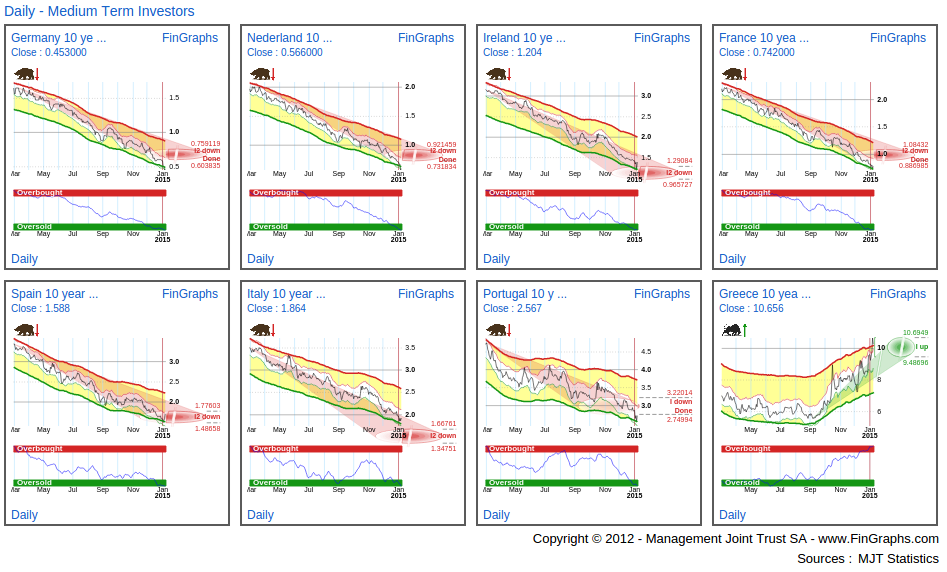
The upcoming Greek election and the possibility of default are clearly visible as far as Greece is concerned (last chart: rising Greek yields). However, on other Eurozone benchmark bond yields, there seems to be little recognition of it. GREXIT doesn’t seem to be taken seriously or at least its consequences are not being feared. Indeed, the Eurozone contagion safety net has been widely improved since the last crisis (limited private exposure to Greek Government debt, a larger Eurozone Bail-out fund, a stronger Banking Union and the prospective ECB QE Government Bond Buying program limiting the risk of contagion), but can it really explain this lack of reaction. When all charts are concerned, it seems like some kind of Greek debt renegotiation could be in the cards, rather than default for now.
Another consequence on an imminent Greek and subsequent Eurozone crisis would probably be a strong sell-off in Eurozone equity markets.
Selected Eurozone Equity markets on this FinGraphs’ Daily Mosaic:
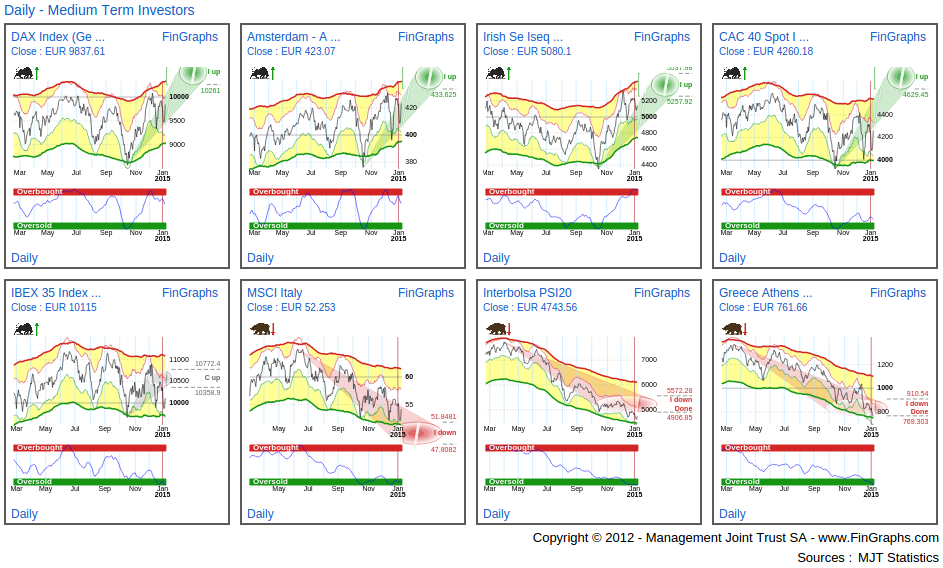
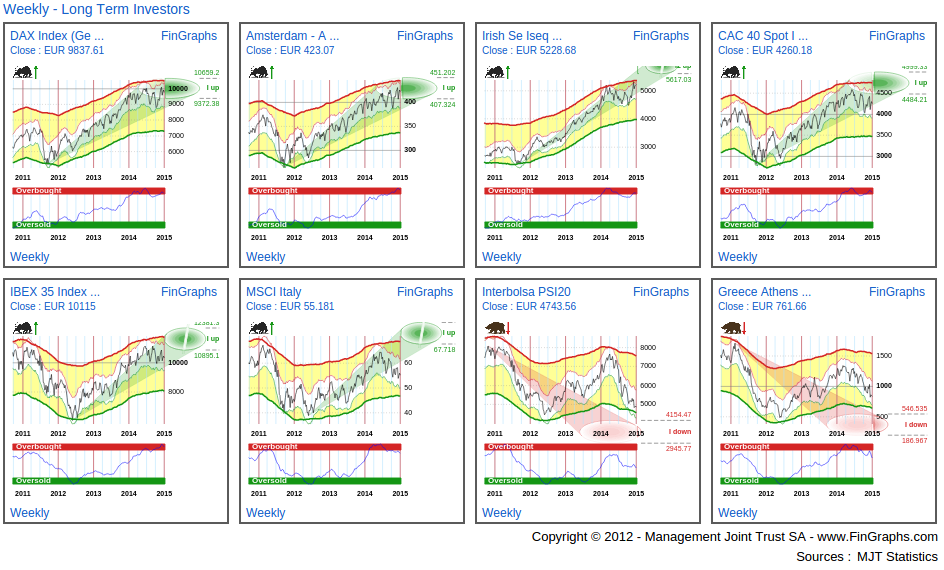
Although the last couple of months have seen some consolidation, stronger markets such as Germany, the Netherlands, Ireland or, on the weaker side, France should be heading higher with more potential to come in coming months. Spain and Italy have held previous lows and although Italy would still be negative in FinGraphs terms, both are well Oversold on our Risk Index. This leaves Portugal (with its own bail-out problems) and Greece on new lows. Although quite differentiated, and revealing of some concern, these performances are not what could be called a widespread sell-off. They mostly highlight some concern along the fringe of the Eurozone. Indeed, most Weekly potential Uptrends are still in place (if one excludes Portugal and Greece).
Selected Eurozone Equity markets on this FinGraphs’ Weekly Mosaic:
We now revert to a chart we presented a few months back (http://stockcharts.com/articles/tac/2014/11/fingraphs-fingraphs-dax-vs-spy-is-the-tail-wagging-eurusd.html
). It is a ratio of the DAX vs the S&P500, it compares the absolute performance of both indices like to like (no currency effect, i.e. EURUSD effect is hedged-out). The DAX in a way represents the Eurozone’s largest and most dynamic market. We believe, its like to like performance vs the S&P500 may provide some advanced indications of a change in attractiveness of Eurozone assets vs their US counterparts. At least, this has seemed to be the case, empirically, in recent history.
Ratio analysis – Weekly chart DAX vs S&P500:
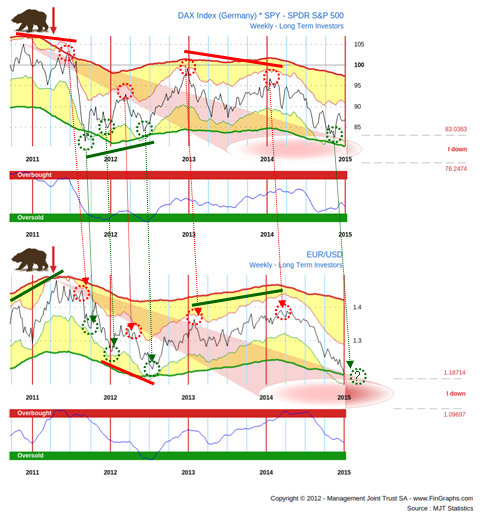
In our past contribution, we had noticed, that divergences between this ratio and the developments in the EUR/USD did have some forecasting value to identify important reversals in EUR/USD (the divergence lines on the chart above). We had also mentioned that tops and bottoms in this ratio did precede tops and bottoms in the EUR/USD by 1 to 3 months. We have taken this second argument a bit further in the chart above and have drawn the time relationships between the corresponding tops and bottoms we could identify.
Considering the recent history, we cannot speak of a divergence yet (i.e. no major reversal of trend on EUR/USD). However, a potential intermediate bottom can be identified in the ratio in the 4th Quarter of 2014. If the empirical relationship still holds, one would expect some kind of a rebound on EUR/USD in the near future.
We will conclude with this Investor’s View of EUR/USD (an Investor’s View is a combination of a Weekly, a Daily and an Hourly chart):
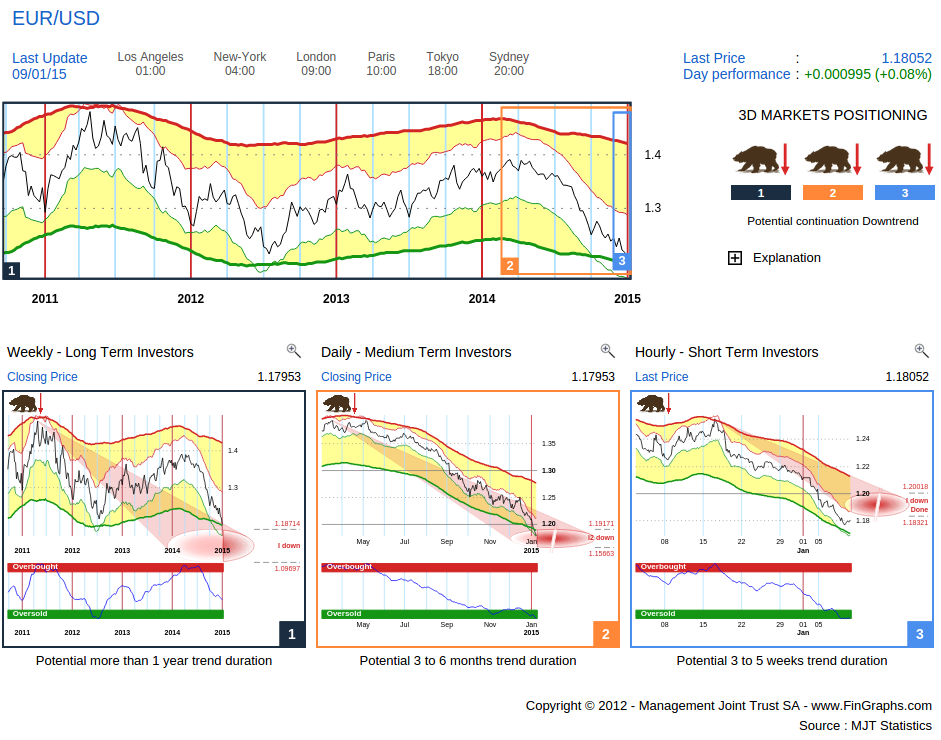
The Weekly (left-hand chart) still has some potential down over the next few quarters (“I down” possible target zone between 1.187 and 1.097) and is not yet Oversold. Yet, the Daily (middle chart) has entered the Impulsive 2 target zone (“I2 down” or extended target zone) we had been targeting over the last few months (1.192 – 1.156) and its Risk Index is well Oversold. Although, EUR/USD could reach out a couple figures more (1.156), its potential down over the next few months does seem somewhat exhausted. The Hourly chart (right-hand chart) is also close to targets and well Oversold.
We would like to relate this situation to the announcement of a “not too aggressive” Eurozone QE plan, to a settling of what seems to have been a GREXIT Bluffing contest or to a turn-up in the attractiveness of the DAX vs the S&P500. We hence highlight the possibility of an intermediate bottom on EUR/USD at this stage.
Longer term (Weekly charts), we remain bullish on the Dollar and on US markets vs their European counterparts.
For more information on our methodology click here (http://www.fingraphs.com/#couponid-STKCHARTS14) and then visit ‘About Us/Press release’ and ‘User Guide’ sections of our website. Clicking that link also qualifies you for a 7 day demo and a 10% discount on our services if you choose to subscribe.
Have a great weekend, J-F Owczarczak (@fingraphs)