Market Recap for Thursday, December 10, 2015
We finished higher across all of our major indices, which is a positive. The negative, however, is that we saw much higher prices earlier in the day only to watch them deteriorate in the afternoon. I never like afternoon selling, especially when history tells me we're in a difficult period. The December 7-December 15 period definitely qualifies as "challenging" historically. Yesterday's strength was not felt across the board as utilities (XLU) lost 1.65%, perhaps anticipating the first rate hike in 9 years early next week. After double topping at 45.50, the XLU remains in a downtrend and will likely revisit price support at 40.50 as reflected by the following chart:
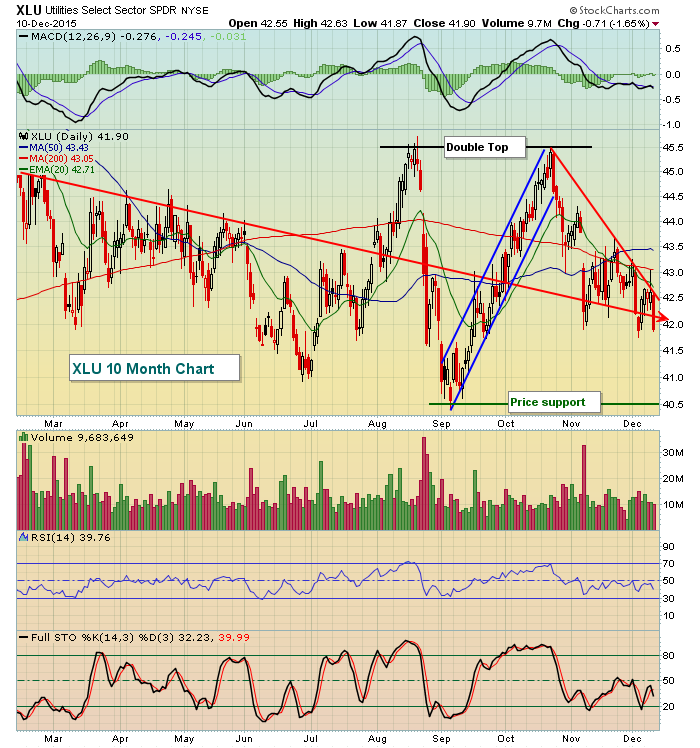
The overall downtrend in utilities is somewhat apparent and is probably due to the anticipation of at least one rate hike approaching. I wouldn't be comfortable owning this group until either price support at 40.50 is tested or until the recent downtrend line was broken with gusto.
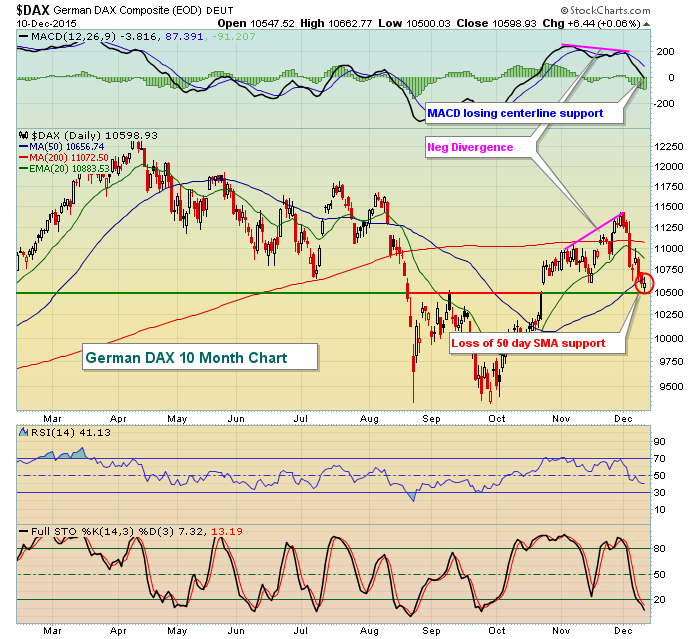
One big problem that surfaced on Thursday was the continuing weakness in German shares and that tends to be a very relevant factor in determining the direction of S&P 500 prices. It started with a negative divergence on the early December price high. Since then we've seen further deterioration as the DAX has now lost MACD centerline support and its 50 day SMA. Key price and gap support remain at 10500 and that level is being lost in early trading on Friday.
Pre-Market Action
Economic reports have done little this morning to change the direction of U.S. futures, which are clearly down. This weakness comes on the heels of a mixed Asian market overnight and very weak European markets. The German DAX is below key support at 10500, as mentioned above and that's likely to keep pressure on U.S. stocks today. Throw in the rising VIX and key 20 support there and it could be an ugly day today. At least conditions are ripe for selling, perhaps impulsive bouts of selling with significant losses. The resiliency of the bulls will be under intense pressure from the opening bell.
Current Outlook
Things are going to get very interesting for traders today. We've been wavering back and forth technically in recent days, but under the surface conditions are changing. Here's what we've witnessed in the past few days to few weeks:
1. Volatility ($VIX) is nearing key resistance at 20
The VIX is the sentiment indicator I follow most closely. If you look back at the history of the VIX, most bearish periods and panicked selloffs occur when the VIX rises above 20. On Thursday, the VIX closed at 19.34 and barely budged to the downside despite all of our major indices finishing higher on the session. A rising VIX suggests that conditions are ripe for impulsive selling episodes. While the bulls have been extremely resilient when dealing with market weakness since the late September lows, they're much less able to cope during periods of high expected volatility and that's what they'll be faced with as today's session opens. Here's the current look at the VIX, along with the impact a higher VIX has on S&P 500 prices:
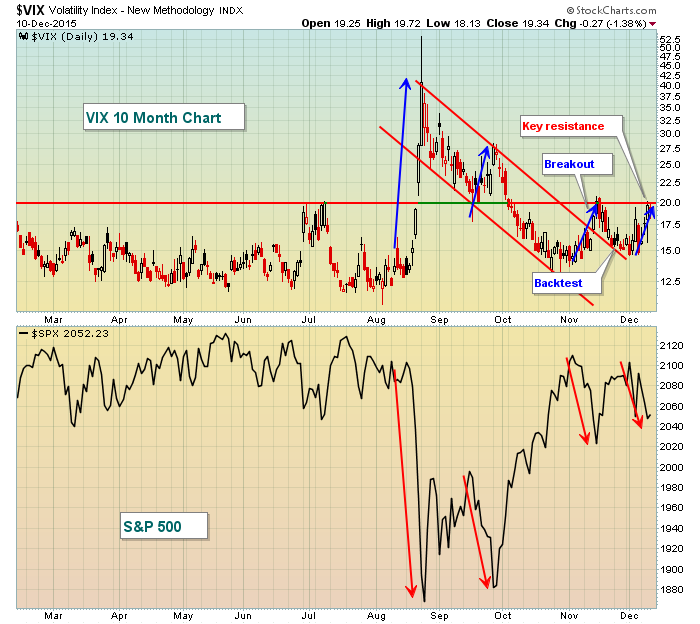
A spiking VIX can lead to very significant losses on the S&P 500 in a short period of time. Conditions are changing and a breakout on the VIX above 20 could lead to rapidly deteriorating prospects for equity bulls. Please understand the short-term risks are increasing.
2. Money has been rotating toward staples within the consumer space
Since topping near 1.66, this relative ratio (XLY:XLP) has fallen back below 1.60 and has been dropping almost daily.
3. Money has been rotating toward utilities vs. transports
The TRAN:UTIL ratio topped in early November close to 14.80 and in recent days has dipped back below 14.00. The long-term MAJOR support level is at 13.00 so the ratio has room to fall near-term while still maintaining an overall bullish bias in the long-term.
4. Russell 2000 vs. S&P 500 threatens relative breakdown again
The RUT:SPX ratio topped back in June and has been steadily on the decline ever since. It's one of the more bearish signs in my opinion and isn't far from another breakdown at .55.
5. Historical behavior supports the bears currently
More on this below in the Historical Tendencies section, but the next few days have historically favored action to the downside prior to an end of year rally.
6. German DAX breaking below 10500 price support this morning
I have posted another chart of the DAX in the Market Recap section above, but the fact that the DAX and S&P 500 tend to mirror one another bothers me as the DAX potentially loses short-term price support at 10500. It would seem that the S&P 500 is likely to be next.
7. The Federal Reserve announces its interest rate intentions next week
The 10 year treasury yield ($TNX) has been moving lower again in recent days and currently resides near 2.20%. But the low established early in 2015 and subsequent rise off that low tells me the treasury market is pricing in our first rate hike in the U.S. since 2006. Rising rates off of record lows can be a very good thing for equities, but the uncertainty of whether we're going to see the Fed raise next week and how frequent and how long rates could move higher have traders on edge.
8. Crude oil ($WTIC) having trouble finding a tradable bottom
What's left to say? There's a demand problem globally and OPEC is determined to maintain market share so production has not been cut. The continuing drop in oil prices is deflationary and goes counter what the Fed is trying to do - to inflate our way out of the 2008-2009 debacle. This is a continual uncertainty that the market is likely to continue to face for the foreseeable future.
Sector/Industry Watch
Technology has remained close to the top of the sector leaderboard over the past week and past month and appears to be vulnerable to more significant losses on a relative basis due to negative divergences that are printing on key areas within this space. Internet stocks ($DJUSNS), for instance, boast excellent seasonal patterns in the 4th quarter of the calendar year and they've performed exceptionally well this year. But negative divergences could slow the party, especially if overall market selling pressure accelerates. Take a look at the negative divergence here on the daily chart:
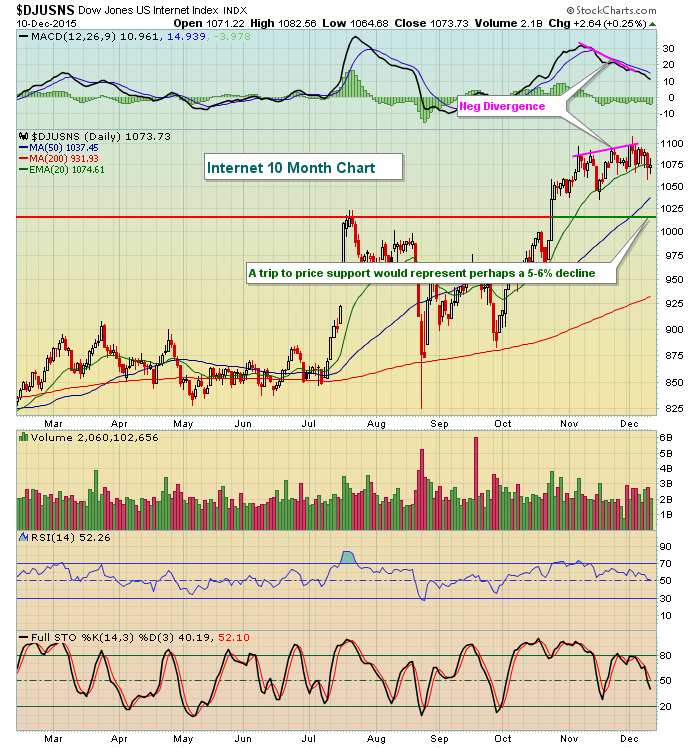
A MACD centerline "reset" would suggest a 50 day SMA test ahead. That 50 day SMA currently resides at 1037. Just below the 50 day SMA is price support that has not been retested since the breakout in October above 1015. A short-term pullback to test 1015 would require selling of 5-6%, certainly possible if the overall market loses near-term support. While the daily chart of the DJUSNS supports a 5-6% drop, so does the weekly chart which is much more bullish. Take a look:
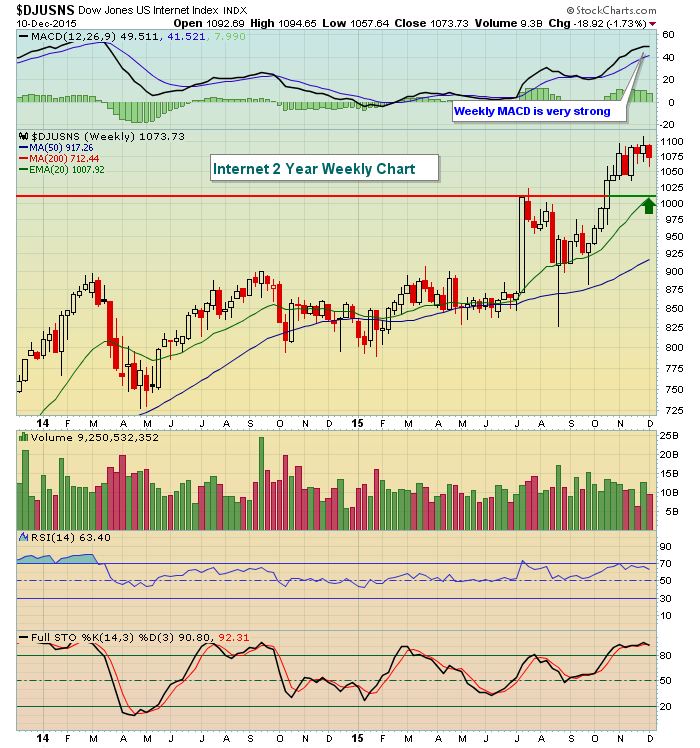
Unlike the daily chart, the weekly MACD shows accelerating longer-term momentum to the upside. But a 20 period EMA test when in an uptrend is always acceptable technical behavior. Note that the 20 week EMA is currently at 1008. So a short-term drop to test this rising 20 week EMA would be an excellent area to enter internet stocks. That coincides with the daily chart's needed pullback to relieve the momentum issues there. I am preparing to buy internet stocks if we see a selloff and internet stocks lead the selling. There is no guarantee, but I'm looking to reduce risk and I believe catching stocks like Alphabet (GOOGL) on more significant selling provides a solid reward to risk strategy and that's how I use technical analysis.
Historical Tendencies
As a reminder, here are the annualized returns from December 11th through December 15th for the S&P 500, NASDAQ and Russell 2000:
S&P 500 (since 1950):
December 11 (today): -40.51%
December 14 (Monday): -50.93%
December 15 (Tuesday): -35.87%
NASDAQ (since 1971):
December 11 (today): -93.65%
December 14 (Monday): -105.80%
December 15 (Tuesday): -60.49%
Russell 2000 (since 1988):
December 11 (today): -98.39%
December 14 (Monday): -79.24%
December 15 (Tuesday): -105.68%
The good news is that December is typically very bullish across all of our major indices. But, for whatever reason, the December 7 to December 15 period has always been challenging and the 11th through 15th is generally the most bearish part of the period as reflected by the annualized returns by day above. The bulls need a bridge from today through Tuesday's close. Once we get there, we'll re-evaluate the technical picture and go from there. Be careful in the near-term.
Key Earnings Reports
None
Key Economic Reports
November PPI released at 8:30am EST: +0.3% (actual) vs. +0.0% (estimate)
November Core PPI released at 8:30am EST: +0.3% (actual) vs. +0.1% (estimate)
November retail sales released at 8:30am EST: +0.2% (actual) vs. +0.3% (estimate)
November retail sales less autos released at 8:30am EST: +0.4% (actual) vs. +0.3% (estimate)
October business inventories to be released at 10:00am EST: +0.1% (estimate)
December consumer sentiment to be released at 10:00am EST: 92.0 (estimate)
Happy trading!
Tom


