Market Recap for Friday, December 11, 2015
Friday was a very rough day for U.S. equities on a number of fronts, but the most obvious was the approximate 2% loss that each of our major indices sustained. In my Friday blog article, "Futures Tank, Bears Have A Big Opportunity", I pointed out a number of reasons why I've grown much more cautious near-term with the first one being high expected volatility ($VIX). Here's a reprint of a VIX chart that I provided in the DITC blog over the weekend:
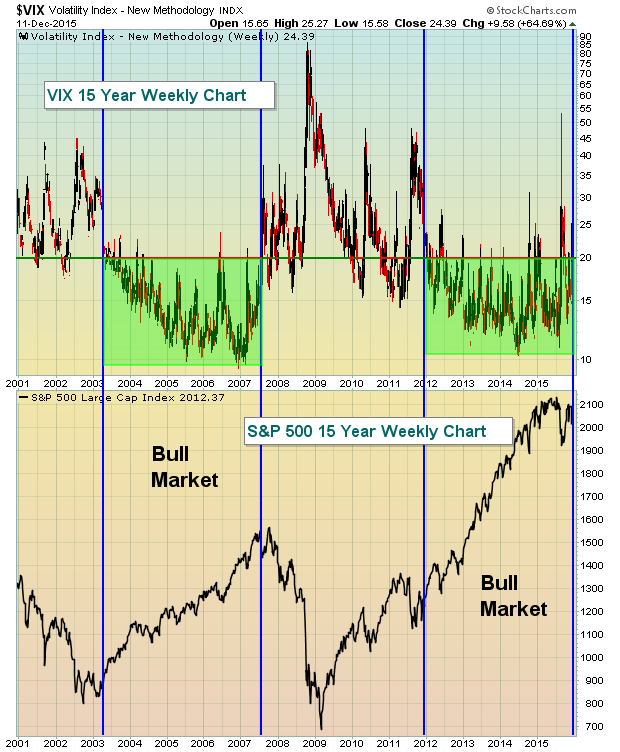
During bull markets, spikes in the VIX above 20 tend to be short-lived. To the contrary, bears THRIVE on a high VIX during bear markets. It's the higher expectation of volatility that suggests market participants are unlikely to disregard bad news like they do during bull markets. We saw on Friday how quickly selling intensified here in the U.S. after a key support level was lost in Germany (see Current Outlook section below). That's what happens when the VIX is high - the market sells off and asks questions later. And if you study history, you know that the stock market moves lower much more quickly than it moves higher. I try to avoid buying anything into this weakness until a sign that the selling is over. That typically is a reversing candle of some sort - hammer, doji, bullish engulfing, piercing, etc - on high volume. Instead, on Friday we saw the S&P 500 lose key price support at 2020.
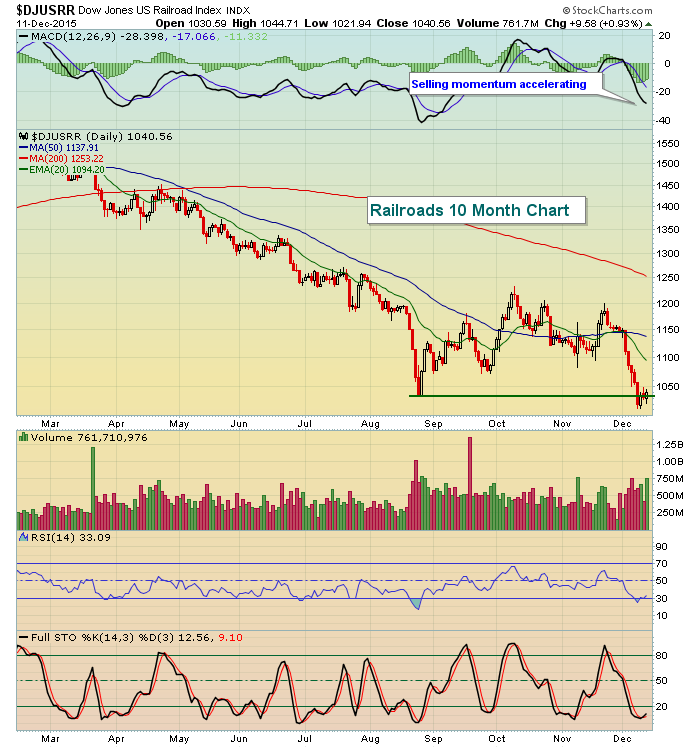
All nine sectors were down on Friday, led by energy and materials once again. One notable industry group that held up well was railroads ($DJUSRR) as they are trying to hold the line on selling at their August price low:
While railroads performed well given market conditions Friday, airlines ($DJUSAR) were among the worst performers despite tumbling crude oil prices ($WTIC).
Pre-Market Action
I'm keeping a very close eye on Germany to see if the DAX can reverse after that index broke down on Friday. Here's the chart showing the technical break:
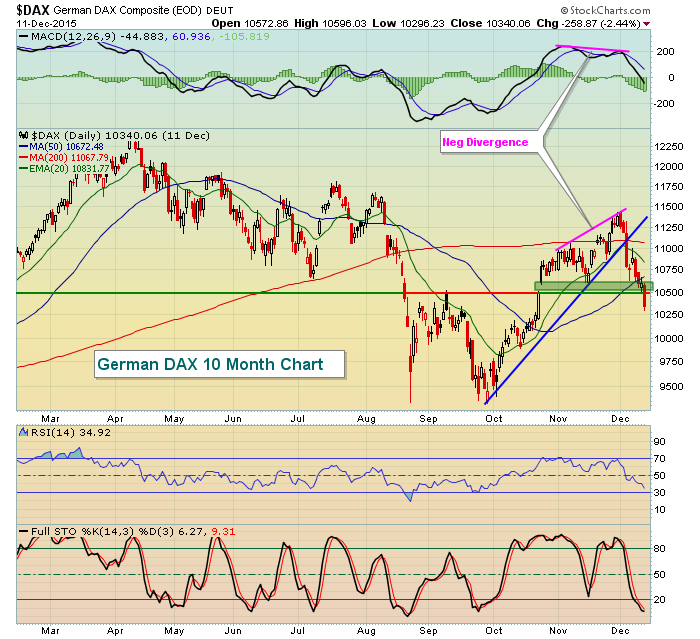
Friday's candle cleared both price and gap support after a long-term negative divergence printed, a trendline was broken, and both the 20 day EMA and 50 day SMA were lost. That's not good news for the S&P 500 since that benchmark index tends to move in concert with the DAX. Perhaps we simply need to see our major indices become technically oversold (RSI 30 or lower) before a rebound occurs. Or perhaps the market will restore itself magically as a more bullish historical period emerges December 16. Maybe the Fed will calm traders' nerves. Whatever the case, I want to see a convincing reversal take place before committing on the long side.
U.S. futures have been all over the map this morning with our major indices at one point higher by 1%, but quickly reversing and moving into negative territory. We are likely to be dealing with these impulsive moves to the downside in the near-term. Will the bulls have enough support to turn the tide into the close? We'll find out later today.
Current Outlook
Very significant short-term price support was lost on the S&P 500 on Friday and the bulls' best chance at limiting the technical damage this week will be to quickly regain that price level and to send the VIX back down beneath 20. Check out this key price breakdown and note the high volume that accompanied it - bearish action indeed:
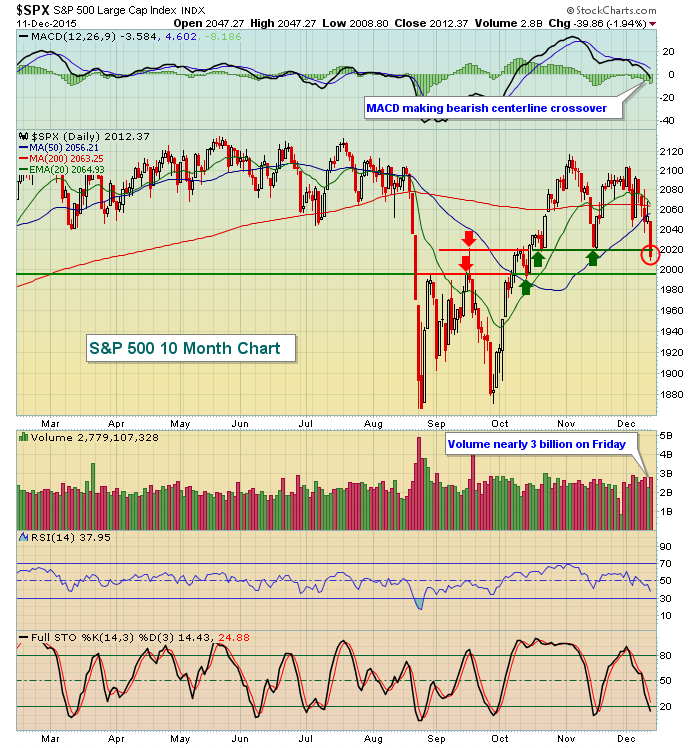
The red circle above highlights the short-term price support level at 2020 that was broken at Friday's close. You can see that volume was strong and that combination - price breakdown with heavy volume - must be respected, especially when we see the VIX spike well above 20. Conditions are ripe for rapid deterioration in market conditions and we know historically these next couple days (through December 15) can be rough. Look for rapid price swings in BOTH directions with an overall bias lower in the very near-term. This morning's big reversal in futures demonstrates what we'll likely face today and tomorrow as traders brace for what is likely to be the first interest rate hike in the U.S. in 9 years.
Sector/Industry Watch
The consumer discretionary sector (XLY) has been the best sector over the past year, more than doubling the returns of any other sector during that period. Short-term support is rapidly approaching, however, and if it's lost we'll likely see a more dramatic selloff in this space. Here are the key levels to watch today, especially with the VIX soaring back above the 20 level:
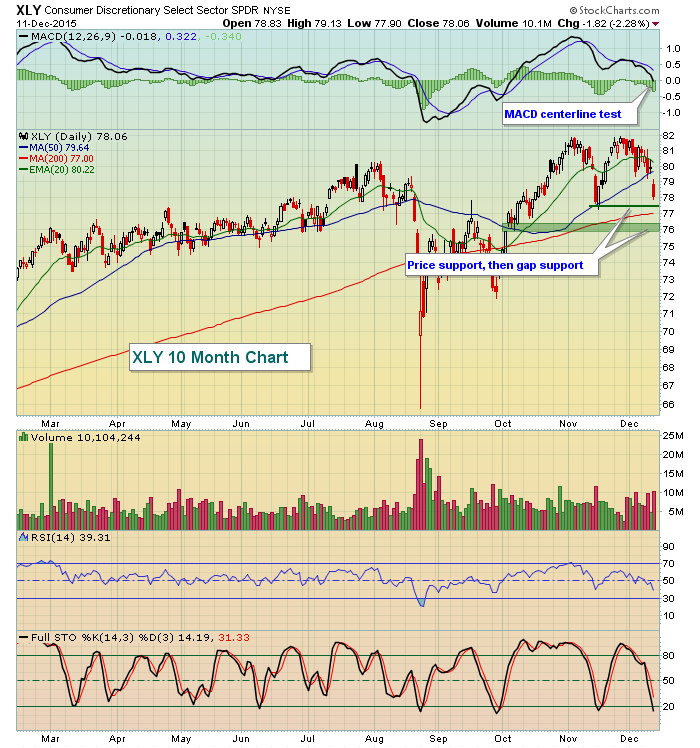
Over the past month, consumer discretionary (XLY) has trailed the performance of consumer staples (XLP) by more than four percentage points, its worst one month relative performance in more than a year. This tells us that money is flowing into defensive areas and so long as that continues, short-term market prospects are bleak.
Historical Tendencies
While we're currently in a period of historical bearishness, that quickly changes as you can see below from the daily annualized returns on the NASDAQ since 1971:
December 14 (today): -105.80%
December 15 (Tuesday): -60.49%
December 16 (Wednesday): +114.10%
December 17 (Thursday): +47.03%
December 18 (Friday): +61.31%
Key Earnings Reports
(actual vs. estimate):
PBY: .02 vs .06
(reports after today's close, estimate provided):
PAY: .40
Key Economic Reports
None
Happy trading!
Tom
