Market Recap for Friday, March 4, 2016
All of our major indices ended last week on a high note as U.S. stocks finished with more gains. There's been very solid index and sector rotation to support the recent bullish action and a renewed selling effort in treasuries (and a corresponding spike in treasury yields) has provided proceeds to further aid the equity rally. But the bulls had quite an opportunity to hit one out of the park on Friday and missed the opportunity. While the overall index and sector rotation has been strong, Friday's action was more subdued with none of our aggressive sectors (technology, financials, industrials and consumer discretionary) parked on the top half of the sector leaderboard. In other words, with the technical game on the line, the offense failed to show up. Check out the Current Outlook section below to review how small caps have been performing and what we might expect there.
Healthcare (XLV) was the weakest sector on Friday and there's plenty of bifurcation within that sector. The medical supplies industry broke out to all-time highs last week and I wrote about that in the Don't Ignore This Chart blog article over the weekend. You can CLICK HERE to review that chart. That area couldn't look much stronger, especially given the overall market action and volatility to begin 2016.
Then there's the health providers index ($DJUSHP) that has climbed recently, but only to test its key 20 week EMA, which has been declining for 8-9 months and has provided serious resistance for the bulls on every test. This weakness comes after printing a weekly negative divergence. We have to respect this downtrend as long as key technical resistance levels continue to hold back the bulls. Check out this group:
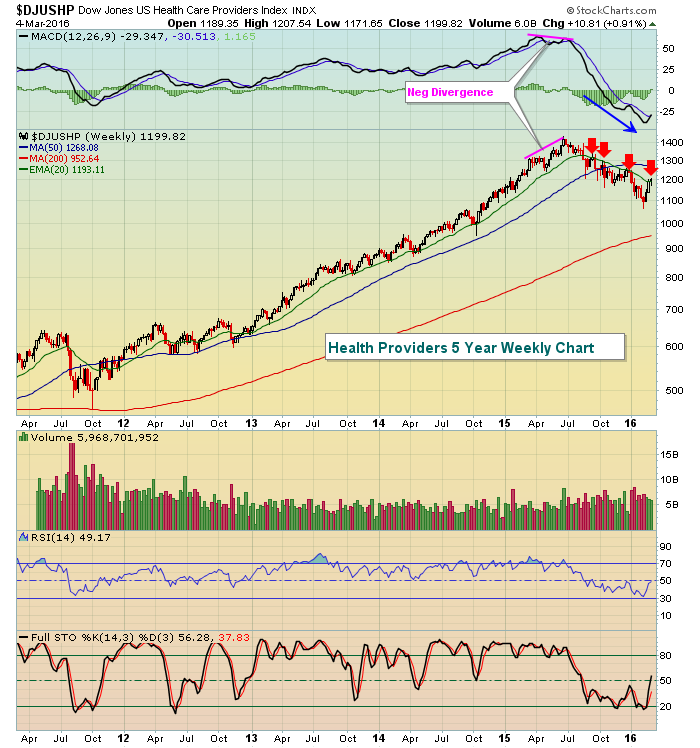 The close on Friday was fractionally above that declining 20 week EMA. There's a big test awaiting in this group this week.
Pre-Market Action
We've seen strength all over the globe in recent weeks, but many of the technical issues here in the U.S. are no different elsewhere. For instance, Tokyo's Nikkei index ($NIKK) has regained 2000 points off its recent low - more than a 10% gain. Yet the longer-term picture still looks bearish. Take a look:
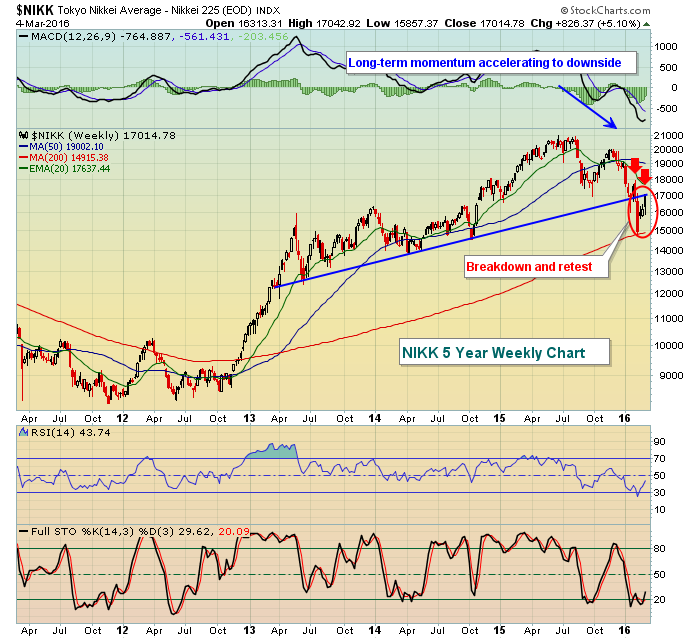 The NIKK broke its uptrend line and is now backtesting that breakdown at the same time it tests its 20 week EMA from below. Throw in that very weak MACD and it would be easy to see the NIKK turning back down from this level.
This morning, action in Europe is weak after seeing mostly downside action in Asia. Futures here in the U.S. are slightly lower with little or no economic news due out until Thursday of this week. So traders will be focusing on technical conditions, which may not be a good thing.
Current Outlook
Recently, it's been all about offense in terms of relative performance. Take a look below at how the Russell 2000 (small caps) has been outperforming the larger cap S&P 500:
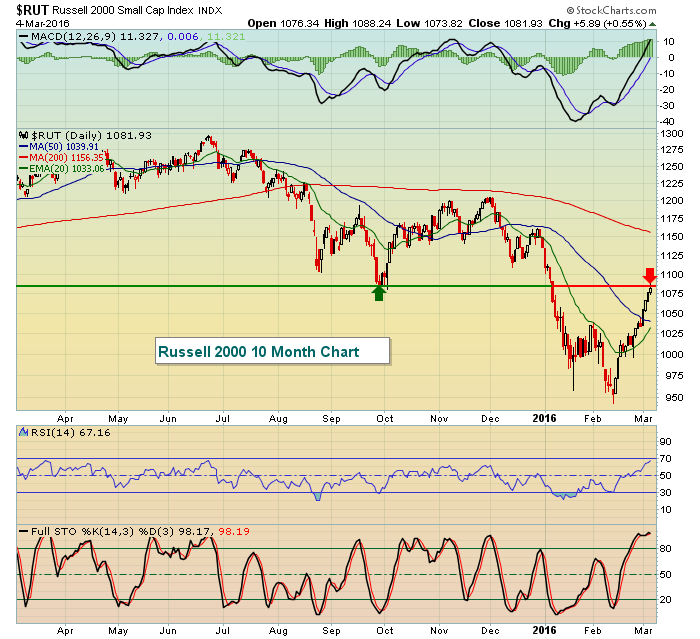
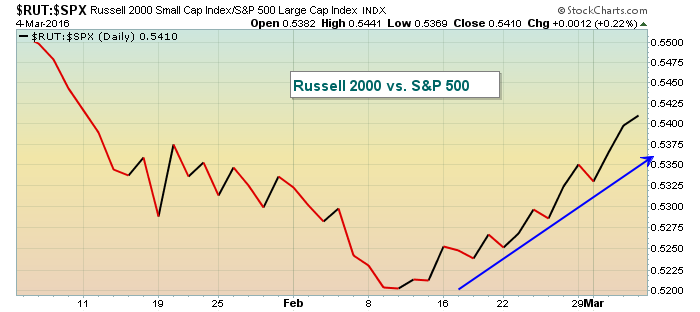 The above chart simply shows us if the Russell 2000 is outperforming the S&P 500 (trend rising). Throughout this latest rally, money has been shifting towards aggression, which is a very good sign suggesting sustainability. That's the good news. Now for the bad. Not only is the Russell 2000 hitting key price resistance, but the above ratio is hitting relative resistance as well. First for price resistance:
 Now the relative resistance on a longer-term chart:
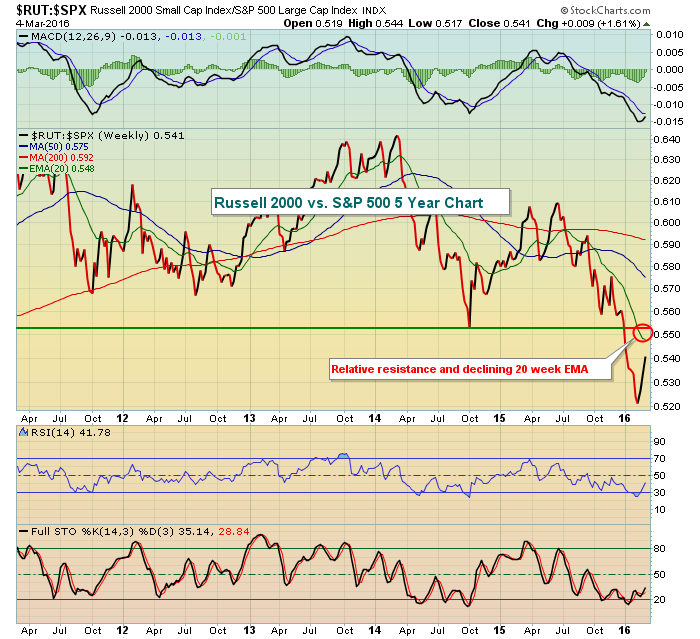 The bulls have battled back nicely the past few weeks, but now it's time for the heavy lifting - clearing key resistance with offense leading.
Sector/Industry Watch
The Dow Jones U.S. Brewers Index ($DJUSDB) had been a very solid performing industry group through the latter half of 2015, but it was slow to react to the recent market strength. Last week, however, it led the consumer staples (XLP) sector and appears to be regaining its relative strength after testing key long-term price support in early February. Check this group out:
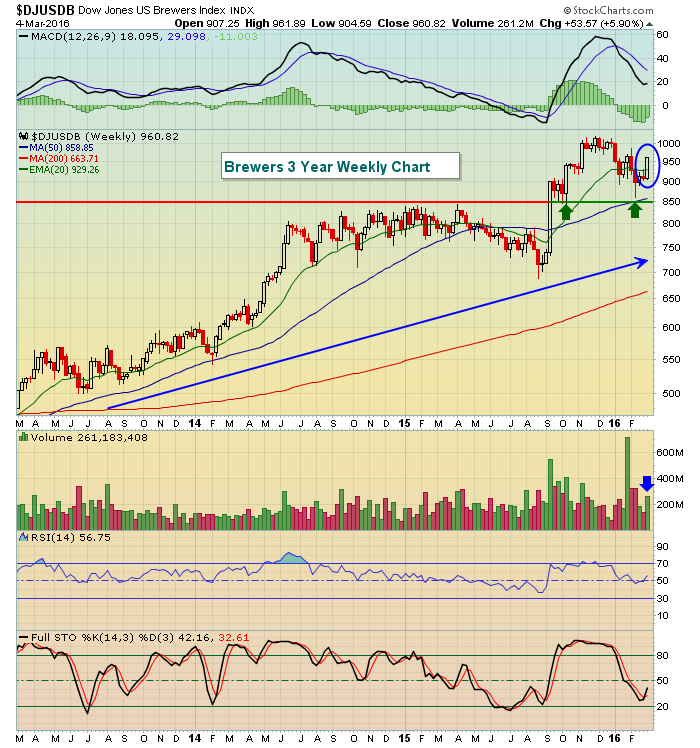 The DJUSDB rallied close to 6% last week after lagging its consumer staples counterparts during the first two months of 2016. It would appear as though this renewed strength will likely last, providing entry points into component stocks on pullbacks to test rising 20 day EMAs.
Historical Tendencies
I've written in the past about the disparity of S&P 500 performance by time period within the calendar month. The 7th to the 10th tends to be bearish, then the 11th to 18th leans to the bullish side. Finally, the 19th to 27th turns negative again historically. I dug a little deeper to review those periods - but during only March, June and September as they represent the month before earnings season kicks off. I excluded December despite this being a month before earnings season kicks off as this month tends to perform opposite many historical trends. The holiday season tends to skew results much more to the bullish side.
Anyhow, looking at March, June and September, here are the annualized returns for the calendar periods mentioned above:
7th through 10th: -11.72% (-6.63%)
11th through 18th: +20.62% (+13.68%)
19th through 27th: -17.28% (-2.57%)
Parenthetically, I've shown what the S&P 500 annualized returns are for these periods during ALL calendar months. From the above, it would appear that the bearish times of the calendar month are exacerbated during March, June and September, while the bullish period also performs better.
Key Earnings Reports
None
Key Economic Reports
None
Happy trading!
Tom
