Market Recap for Wednesday, March 3, 2016
I spoke yesterday about the significance of the XLE's breakout on Wednesday. Thursday's follow through day was impressive as well as the XLE led all sectors, gaining another 1.51%. I'd like to see crude oil ($WTIC) follow the XLE's breakout, which would require a close above $35 per barrel. We're close, not quite there yet.
The S&P 500 closed on its high Thursday to finish at 1993, just a couple points shy of the key 1995 price resistance level that I've spoken about for the past several weeks. That's been a pivot area or an indecision zone. We've seen significant reversals take place here so it's important to see which direction the S&P 500 wants to go after the dust settles from this morning jobs numbers. Take a quick look at the S&P 500 over the past several months to see the significance of this level:
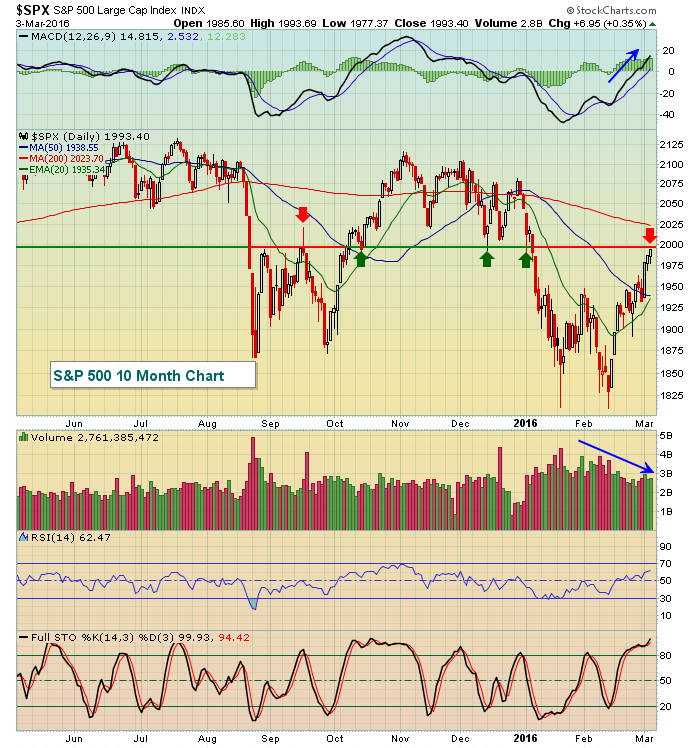 Can we break through 1995 and hold it into today's close? We'll find out later today.
One was to evaluate the strength and sustainability of any move higher it to watch sector rotation. Is money flowing into aggressive areas. I recently pointed out that this rally is being supported by "aggressive" money. That has begun to change over the past two trading sessions and should be monitored closely today on any apparent breakout. Take a look at what could be trouble brewing under the surface of this rally:
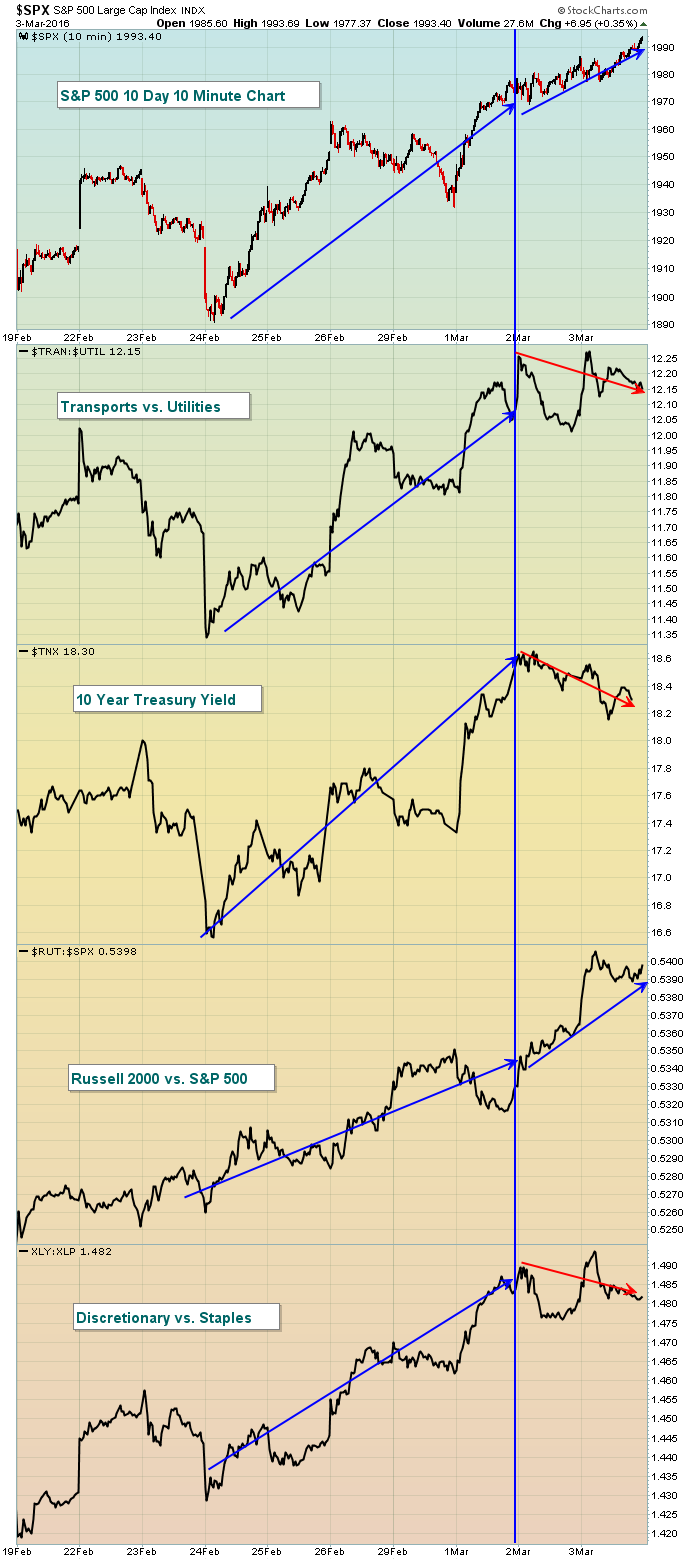 The relative ratios all seem to remain in uptrends, which is good news. But there's been some deterioration over the past two days that bears watching. If the S&P 500 keeps pushing higher, but these relative ratio lines keep dropping, it'll be a signal to short. Obviously, there are no guarantees, but the odds of the rally failing would be greater in my opinion.
Pre-Market Action
U.S. futures were up slightly this morning prior to the jobs report, but have climbed a bit further since. Based on the look at the pre-market action, we should see breakouts to start the day on many key indices, including the S&P 500. So the obvious question becomes, "Do we hold onto these breakouts into the close?" If yes, things become much more dicey on the bearish side. If no, we could be printing a very significant top in a bear market. There's a lot riding on today's action for sure.
Asian markets were up overnight, though the magnitude of the gains slowed from previous sessions. Still, up is up. European markets were higher in anticipation of the U.S. jobs report and they've continued to perform well with the German DAX ($DAX) now within an ear shot of 10000, a level not seen since the gap down following January 13th's intraday high above 10000.
Current Outlook
Well, the stage is set. Honestly, I'm not sure it could have been scripted any better. Just prior to a major economic event - this morning's monthly jobs report - many key indices have touched or nearly touched critical price resistance. It's everywhere and now all of those positive divergences that popped up a few weeks back have played out and those MACDs have reset at or near their zero lines (the point at which 12 period EMAs and 26 period EMAs are equal, thus no momentum). The market could turn either way. The 20 week EMAs are suggesting the odds are greater we move lower from here.
The NASDAQ 100 ($NDX) provides us a good example of what we're facing as trading starts today. First, let's look at the NDX daily chart:
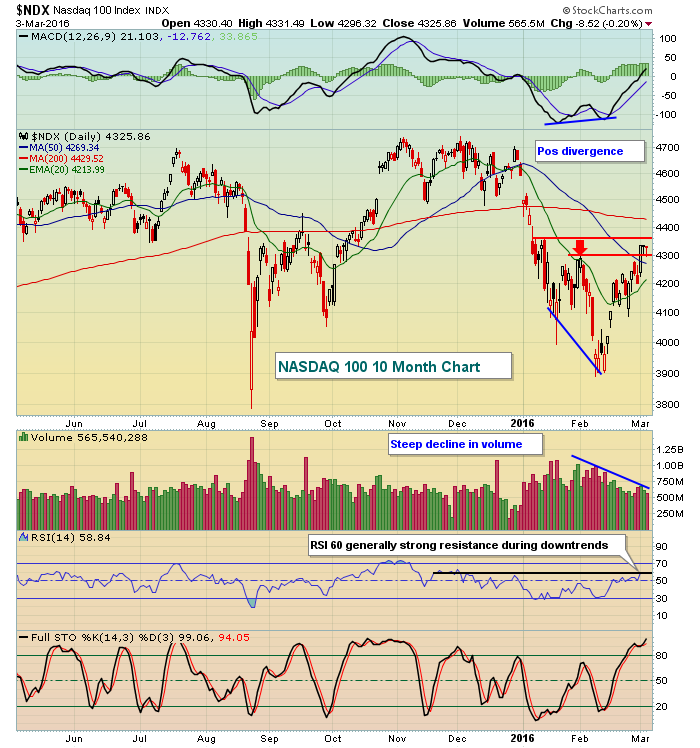 The red horizontal lines mark prior reaction highs and key resistance levels. This rally began with a positive divergence and it's continued past 50 day SMA resistance and it's taken the MACD back through centerline resistance. But two key technical points remain in the short-term. The second red horizontal line that marks the initial reaction high in January. That selling, if you look at the volume bars, came on extremely heavy volume so it's not likely to be an level to clear. Major price resistance resides less than 1% away. Before we move on to the second NDX chart, note the red arrow above. Check out the look of the MACD (pointing straight down at the previous price low) just before the bounce to the 20 day EMA, which is where I've placed the red arrow. 20 period EMAs tend to be a brick wall when the momentum is as weak as it was then.
Now look at the NDX weekly chart and check out the 20 week EMA:
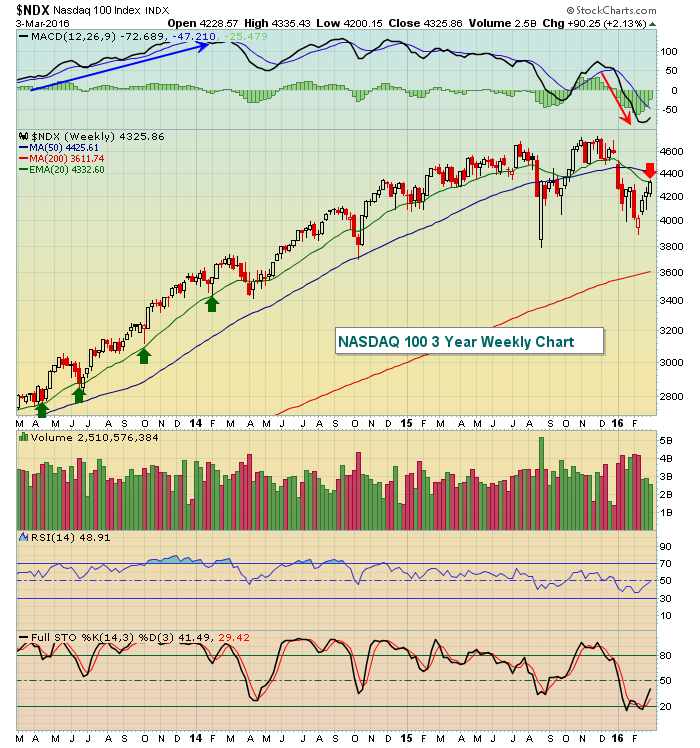 2013 was a perfect example of bullish momentum building with the rising 20 week EMA (green arrows) providing support along the way. The weekly picture has turned much more bearish in 2016, however, with the weekly MACD firmly entrenched below the centerline and pointing lower at its most recent price low. The bounce has enabled price to reach key 20 week EMA resistance (red arrow).
Clearly, we're at a critical juncture technically as we watch today's reaction to the February nonfarm payroll report. Just beware what this weekly chart could mean if price action fails today. Likewise, a solid volume push higher and through resistance will put the bears on notice.
Sector/Industry Watch
Full line insurers ($DJUSIF) have been one of the slowest industry groups to react to the rally in U.S. equities over the past 3-4 weeks. There is a positive divergence supporting the group and it did close just above its 20 day EMA. Therefore, additional strength in equities could propel this group quickly higher to play catch up with the rest of the market. Take a look:
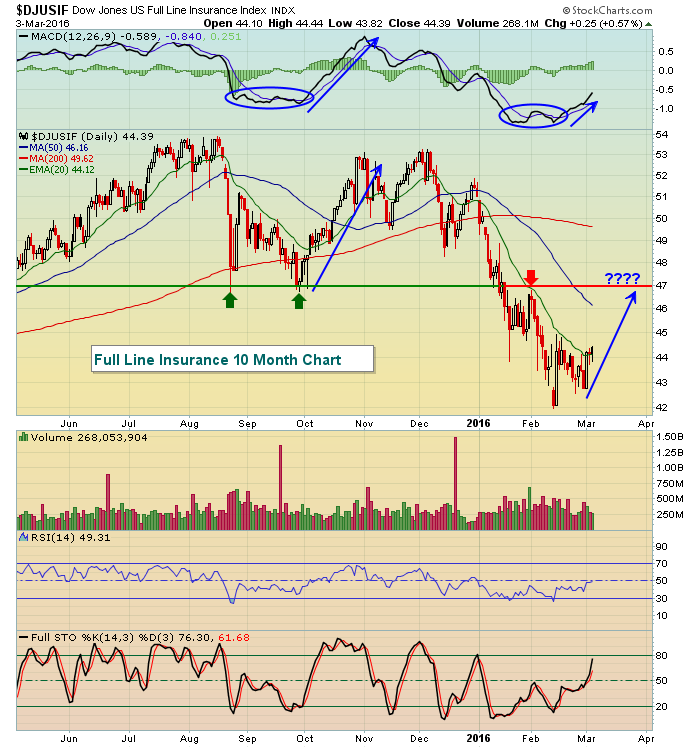 The last time we saw the daily MACD flatten and bottom in September, the DJUSIF exploded higher in October. There's a similar look to the chart now and Wednesday's definitive close above the 20 day EMA could launch the group higher. My biggest problem with this is that the overall market and many sectors/industries are at MAJOR resistance levels and it's hard to imagine this industry group moving appreciably higher if the overall market drops.
Historical Tendencies
The first week of March historically has been quite bullish and this week has not disappointed thus far. March also follows the historical patterns of other calendar months in that the 10th through the 18th produce annualized returns of +37.06% on the S&P 500 since 1950. That is four times higher than the approximate 9% average annual return the S&P 500 has earned over the past 65 years.
Key Earnings Reports
(actual vs. estimate):
SPLS: .26 vs .28
Key Economic Reports
February nonfarm payrolls released at 8:30am EST: 242,000 (actual) vs. 190,000 (estimate)
February private payrolls released at 8:30am EST: 230,000 (actual) vs. 183,000 (estimate)
February unemployment rate released at 8:30am EST: 4.9% (actual) vs. 4.9% (estimate)
February average hourly earnings released at 8:30am EST: -0.1% (actual) vs. +0.2% (estimate)
Happy trading!
Tom


