Market Recap for Tuesday, July 5, 2016
Tuesday represented a down day and a much-needed day of profit taking after the post-Brexit rebound, right? Well maybe. But if my pattern-seeking eyes are correct, the Russell 2000 may have just printed the right shoulder in a bearish topping head & shoulders pattern. Take a look:
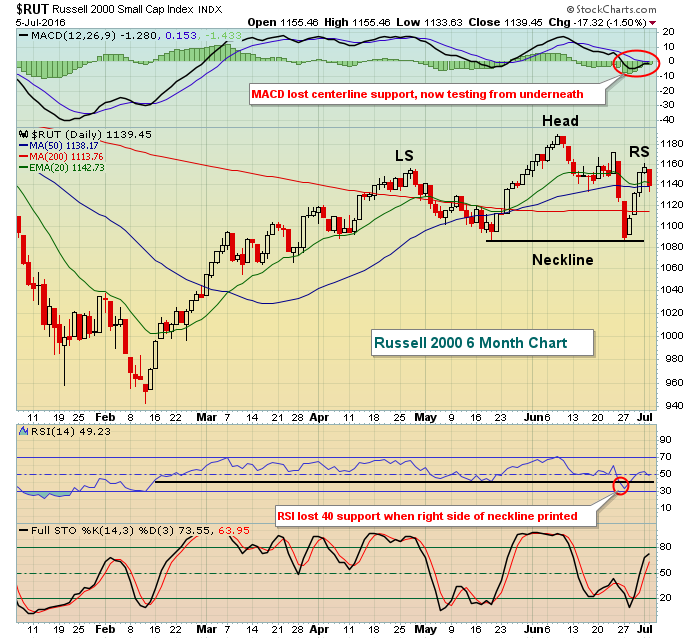 Keep in mind that bearish topping patterns like the one above do not confirm until neckline support is lost. Many such patterns emerge during bull markets only to see the head cleared and further strength ahead. But....we are seeing plenty of other warning signs like the massive rotation toward safer alternatives - like treasuries, for instance. The divergence in performance between the S&P 500 and the 10 year treasury yield is quite evident below:
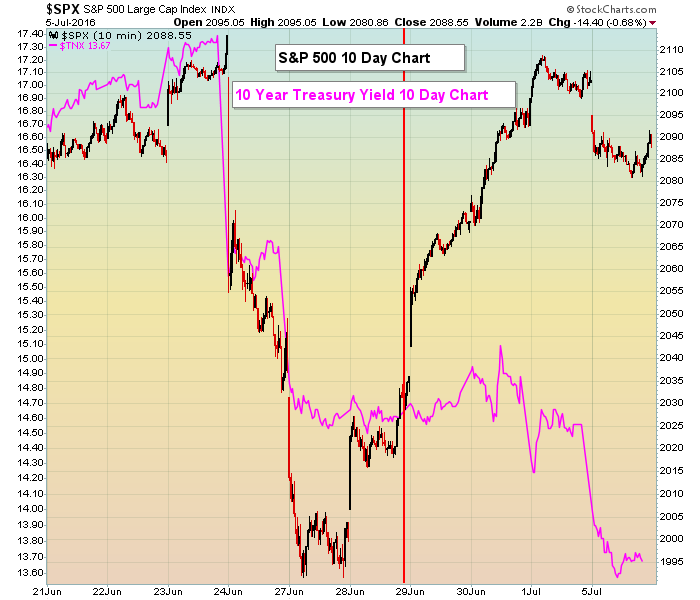 The significance here is that as equities rise, money typically flows away from treasuries (sending the corresponding yields higher). So, in the short-term, the S&P 500 and the 10 year treasury yield ($TNX) tend to move in unison. When they diverge, many times the S&P 500 "catches up" to the TNX as the bond market will lead in most instances. I get very nervous when I see the TNX dropping quickly - as reflected by the pink line in the above chart - while equity prices stall.
Sector performance on Tuesday was an issue as well, with two sectors ending in positive territory - the defensive utilities (XLU, +0.74%) and consumer staples (XLP, +0.56%) sectors. Meanwhile, financials (XLF, -1.50%) were among the weakest performers with key financial industry groups like banks ($DJUSBK), asset managers ($DJUSAG) and life insurance ($DJUSIL) lagging badly once again.
Energy (XLE, -2.01%) was the worst performing sector as crude oil ($WTIC) prices tumbled 4.91% to close beneath $47 per barrel and challenge recent lows set in June.
Pre-Market Action
Global equity markets are mostly moving lower this morning as renewed Brexit concerns emerge. The German DAX ($DAX) is down 2% this morning, while the Tokyo Nikkei ($NIKK) finished lower by 1.85% (and nearly 300 points) after being down intra-session by almost 500 points. The recovery off the bottom was nice, but the NIKK's double bottom near 15000 is perilously close. Loss of that support could mean big trouble for Asian markets in general, with a ripple effect here in the U.S. quite possible.
U.S. futures are weak with Dow Jones futures down 100 points at last check. That will likely continue Tuesday's slide. We'll have to wait to see if the bulls can make another recovery similar to Tuesday's by the close today.
Netflix (NFLX) was downgraded this morning after trading an unusually high number of shares on Tuesday. NFLX is down 2.4% in pre-market action. All eyes will begin to turn to the June jobs report, which will be released at 8:30am EST on Friday.
Current Outlook
The volatility index ($VIX) broke its recent downtrend on Tuesday and could lead to a further rise. Rising volatility can then lead to much more impulsive selling episodes, especially if the VIX is above the 16-17 area - which in the past helps to distinguish between bull markets and bear markets. Take a look at the downtrend break on Tuesday:
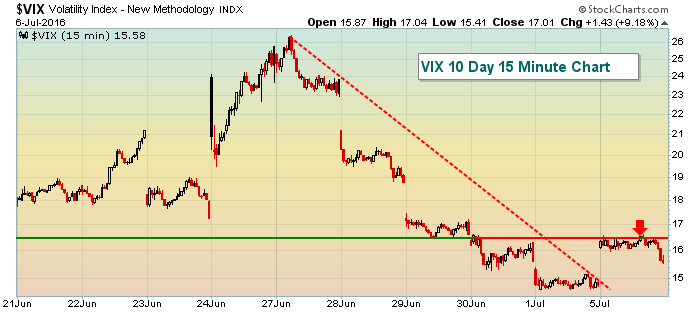 Selling at today's open (following the lead of equity markets globally) will likely enable the VIX to clear Tuesday's high and the short-term critical resistance level of 16-17. That's a sign to be more cautious so buyer beware.
Sector/Industry Watch
Despite weakness in energy shares on Tuesday, the Dow Jones U.S. Integrated Oil & Gas index ($DJUSOL) managed to produce only a fractional loss and remains a very strong industry group. Take a look:
 The group bottomed on both an absolute and relative basis during the third quarter of 2015 and the relative strength vs. its peer group and the benchmark S&P 500 is rather obvious. In addition, weekly momentum remains very strong as evidenced by the MACD continuing to point higher with each price high. Pullbacks in the DJUSOL would represent potential buying opportunities in stocks within the industry group. I'll show you how you can find such stocks during my webinar at noon EST today.
Historical Tendencies
We have begun the most bearish four month stretch of the calendar year for small cap stocks. Since 1987, the Russell 2000 has produced annualized returns as follows for July and the successive three months:
July: -6.69%
August: -8.04%
September: -1.77%
October: -7.73
Key Earnings Reports
None
Key Economic Reports
June ISM non-manufacturing index to be released at 10:00am EST: 53.3 (estimate)
Happy trading!
Tom
