Market Recap for Friday, July 1, 2016
Bull markets do the unthinkable and last week was a perfect example. After Brexit, which seemed to confirm global stock markets' worst fear, we saw a very sudden drop in equity prices around the world and a surge in the Volatility Index ($VIX) that we had not seen since January. While a temporary pullback in the VIX is to be expected as the stock market comes to grips with the news, the drop we saw last week was crazy. It was like Brexit never, ever happened......
.....except that sector rotation is telling us a very different story than the sudden drop in the VIX. Consumer discretionary (XLY, +1.04%) was the clear sector leader on Friday, welcome news for sure, but it did not make up for the constant deterioration in the XLY:XLP ratio (discretionary vs. staples) that we've witnessed since April. Money is turning defensive and likely for a very good reason. We'll find out soon if it truly is a warning signal, but check out the chart and how this ratio is diverging from S&P 500 performance:
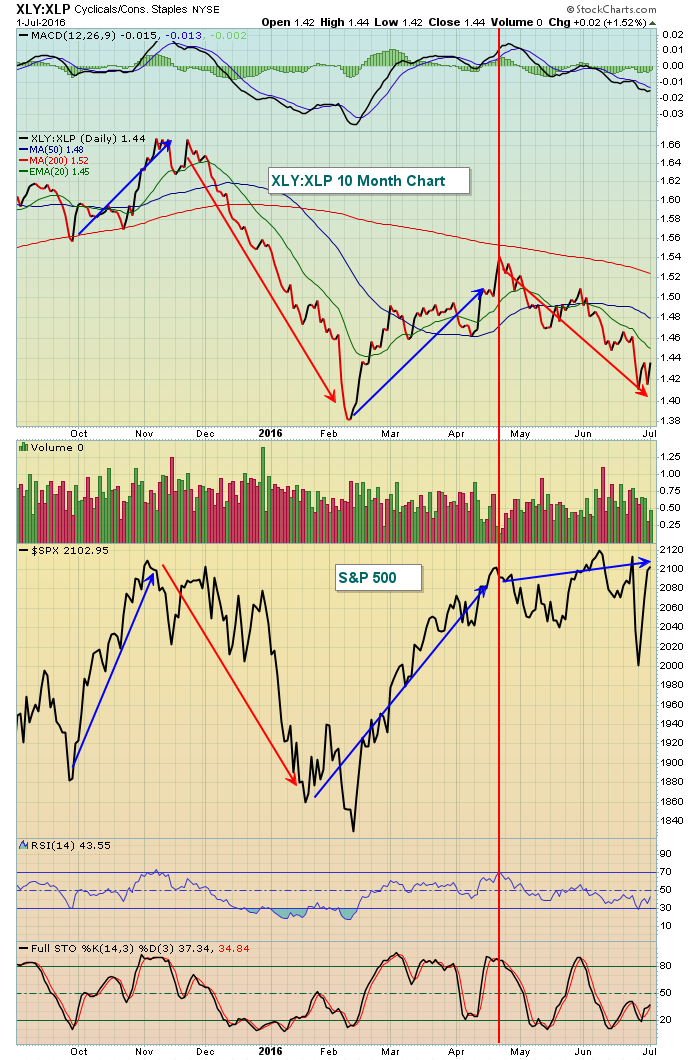 On Friday, I highlighted the positive correlation between the XLY:XLP and the S&P 500. These two tend to move together, hand in hand. But check out the "divergence" since April. The S&P 500 continues to threaten a breakout to an all-time high, but defensive stocks are leading the charge. That's how the bull market ended in 2007 and I believe the risks are really elevated now for the same reason.
Financials (XLF, -0.50%) were the worst performing sector on Friday and that's noteworthy because they led the move to the downside on Brexit and appear to be rolling over in key industry groups. For instance, check out the bank failure in the Sector/Industry Watch section below.
Pre-Market Action
The global rally that we've seen take place since a couple days after Brexit appears to be putting the brakes on - at least temporarily. The Bank of England announced new measures and that helped to lift the London FTSE ($FTSE) to fractional gains this morning. But other European markets are struggling, especially the German DAX ($DAX) where losses on Monday have been compounded by a further decline today. Note that the weakness has occurred just as the DAX hit its declining 20 day EMA.
Markets were mixed overnight in Asia as crude oil prices ($WTIC) are down nearly 3% and U.S. banks are under some pressure in pre-market trading. That's a group to watch very closely.
Current Outlook
The 10 year treasury yield ($TNX) is down again this morning to 1.39% as money floods into the treasury market. The only significant period of time in which the TNX dropped while the S&P 500 pushed higher was from 2010 to 2012 during quantitative easing. Unless you believe the Fed is ready and prepared to begin QE all over again, the relationship between the two markets right now makes little sense. And when there's been divergences in the past, the bond market has typically been the market to get it right. Check out the current divergence in the direction of yields vs. the S&P 500:
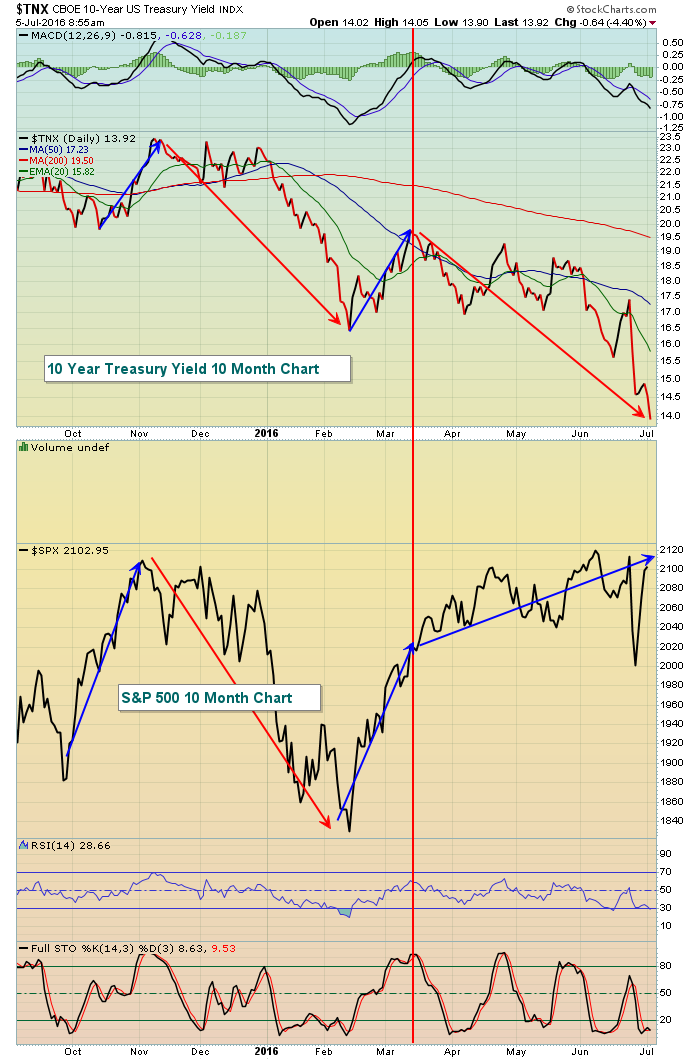 While the stock market has proven it can do anything and we cannot rely on these warning signals, they at least tell me to be very careful and hedge your positions if you remain long. A sudden and large drop would not surprise me given the current market environment.
Sector/Industry Watch
Keep a close eye on banks. Global banks have struggled on a relative basis since Brexit and Friday's relative weakness occurred just as the Dow Jones U.S. Banks index ($DJUSBK) approached a key area of resistance. Check it out:
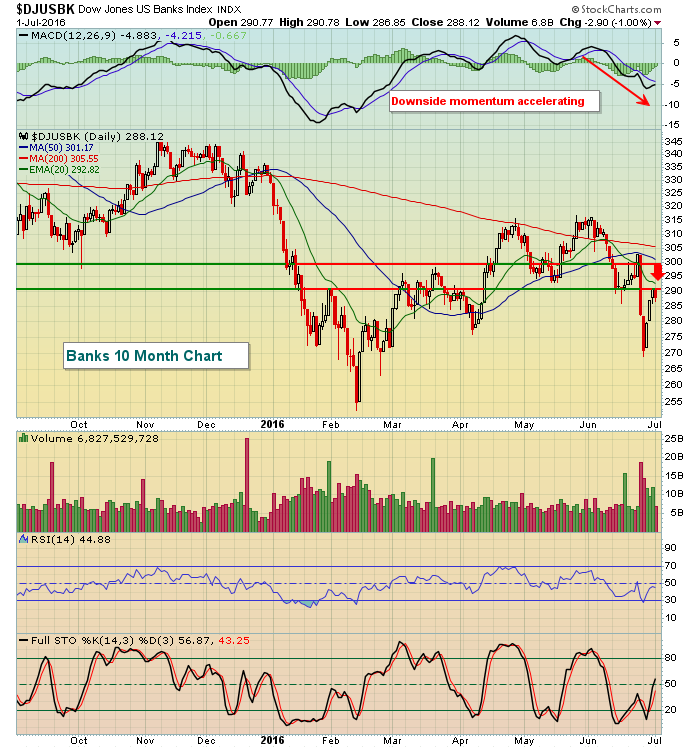 The 290-300 support/resistance zone has been in play for the past 2-3 years and should continue to be respected, especially since the 20 day EMA resides there and is rapidly declining. That 20 day EMA can be very important resistance when the daily MACD looks the way it does now - beneath the centerline and pointing straight down.
Historical Tendencies
July has produced annualized returns of 11.75% on the S&P 500 since 1950. But not all periods within the month should be treated equally. Here's the breakdown by periods within the month:
July 1 to July 17: +23.05%
July 18 to July 23: -24.81%
July 24 to July 31: +18.35
Key Earnings Reports
(actual vs. estimate):
AZZ: .81 vs .83
Key Economic Reports
May factory orders to be released at 10:00am EST: -1.0%
Happy trading!
Tom


