Market Recap for Friday, February 10, 2017
Materials (XLB, +0.91%) and industrials (XLI, +0.79%) led yet another rally in U.S. equities on Friday as the Dow Jones, S&P 500, NASDAQ, NASDAQ 100 and the Russell 2000 all established new all-time closing highs. The small cap Russell 2000 index ($RUT) performed best on Friday, and had a final thrust higher at the very end of Friday's session to fractionally clear its all-time high. Check it out:
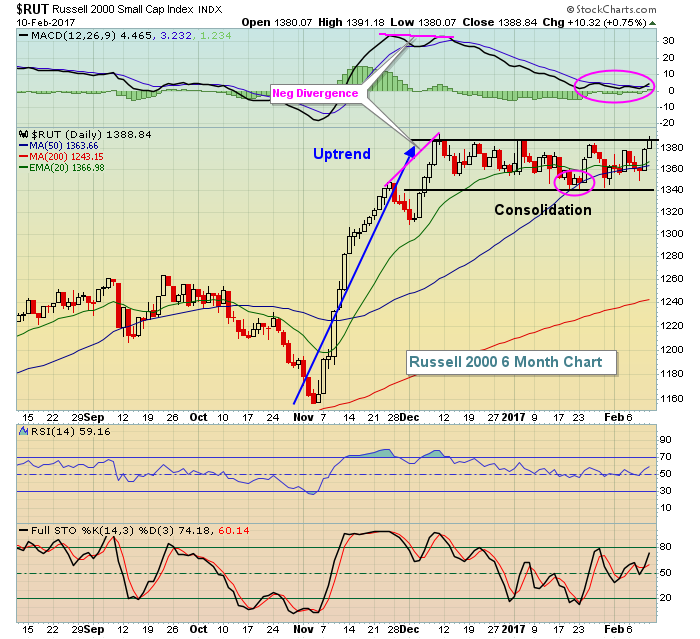 There were momentum issues on the Russell 2000 on its early December high. But those were resolved during the December and January consolidation as highlighted by the 50 day SMA and MACD centerline tests (pink circles). The prior high close in early December of 1388.07 appeared safe until the final five minutes on Friday when small caps turned higher and finished at 1388.84. I'd look for further strength today given the resolution of momentum issues, the Friday late day strength and then the breakout.
Industrials were led by several industry groups, including marine transportation ($DJUSMT), transportation services ($DJUSTS), trucking ($DJUSTK) and commercial vehicles & trucks ($DJUSHR), but aerospace ($DJUSAS) was the one that not only helped lead the action, but also broke out to all-time highs. The other industry groups are bullish in their own rights, but none of those broke out. The DJUSAS has been a clear leader for the past several months, but like the Russell 2000 index, had momentum issues to resolve. I've highlighted the DJUSAS in the Sector/Industry Watch section below.
Pre-Market Action
Global stocks are showing strength with Asian markets mostly higher overnight while European markets have opened higher this morning. Dow Jones futures are up 53 points and again poised to trade in all-time high territory when the opening bell rings in 30 minutes.
The 10 year treasury yield ($TNX) is once again trending higher with its yield at 2.45% this morning. The 2.30%-2.60% range continues as treasury yields consolidate in sideways fashion - typically this technical behavior is a precursor to another move higher. Higher yields mean a selloff in treasuries and those proceeds would likely find their way into equities. So a breakout above 2.60% would continue to favor owning U.S. equities.
Current Outlook
The dollar ($USD) is regaining strength and it's going to be interesting to see how things develop over the next few weeks. The bulls will point to key price support holding with another surge higher likely. This is the camp I'm in and if that occurs, it'll clearly be bearish for commodities, especially gold ($GOLD). But.....gold has been bullish in the near-term and dollar bears will point to the possibility of a head & shoulders top forming on the USD. That development, if confirmed, would no doubt be very bullish for commodities, especially gold. Here's the visual:
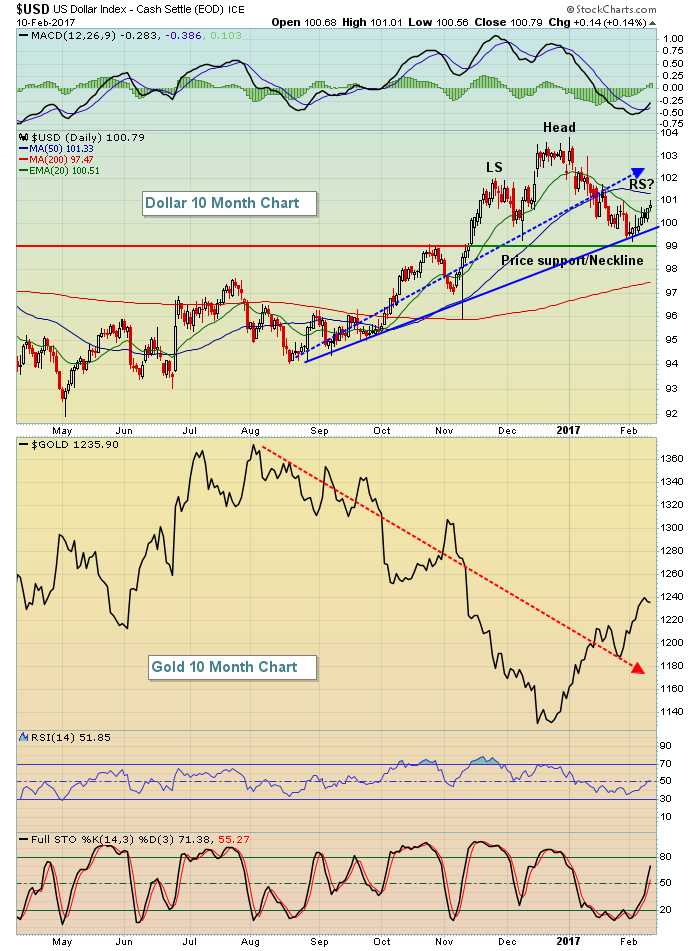 There's a lot going on in this chart for sure. But the biggest "big picture" technical condition to focus on - in my opinion - is the directional lines from late summer through Friday's close. The dollar is in an uptrend while gold has been in a downtrend. Those intermediate-term trends are difficult to deny. The really interesting part is that both the dollar and gold have been rising simultaneously the past couple weeks. One is likely heading in that direction for fundamental reasons while the other is likely heading higher due to a technical bounce only. Look for this to resolve itself in the very near-term. My expectation is that the dollar remains in a bullish uptrend and I'll continue to believe that as long as 99 price support holds. So in my view, the risk resides with gold. However, the current uptrend in gold cannot be argued. Therefore, if you like the gold trade on the long side, I'd be ok with that, but I'd keep a tight closing stop on the GLD beneath its rising 20 day EMA.
Sector/Industry Watch
Aerospace stocks ($DJUSAS) needed a bit of a pause after surging higher from October through December. But after consolidating to unwind its negative divergence, Boeing (BA) led its short-term rally into all-time high territory. Here's a chart of both:
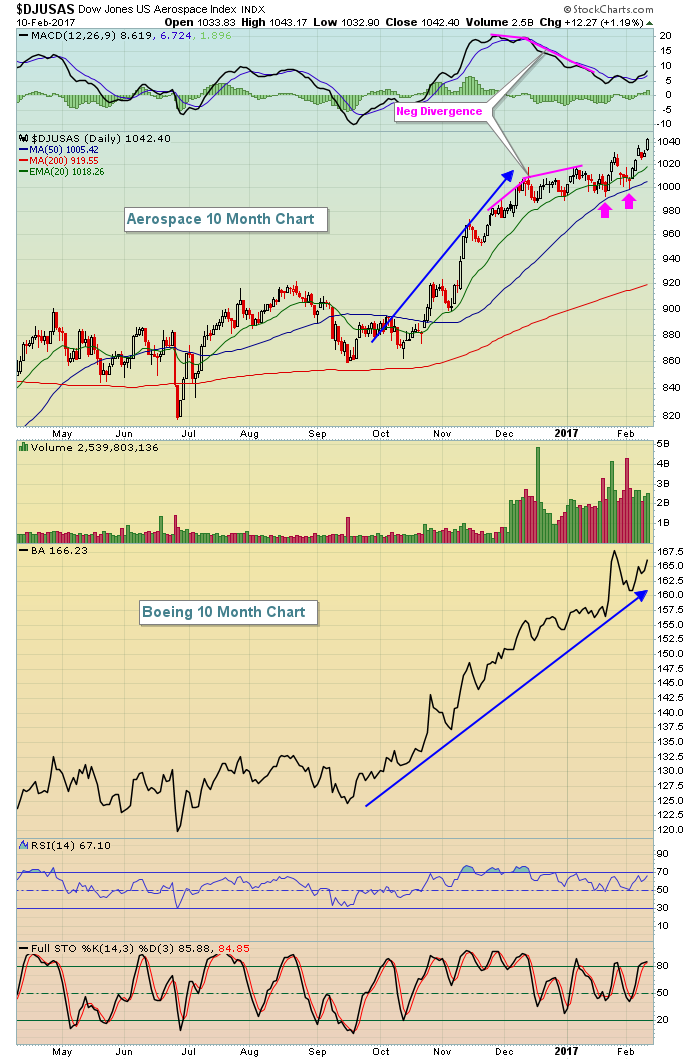 While we didn't get a MACD centerline test, the recent selling in the DJUSAS did result in a couple of 50 day SMA tests (pink arrows) just prior to another key breakout. Aerospace stocks remain a great area to consider for short-term trades on the long side.
Monday Setup
Waiting for strong reward to risk trades can involve several technical developments. Sometimes a healthy stock becomes overbought and simply requires a period of consolidation or selling to set up a solid trade. Or maybe the stock is currently consolidating in a trading range and we have to wait for either the stock to sell off close to trading range support or to break out. That's the case right now for this week's setup:
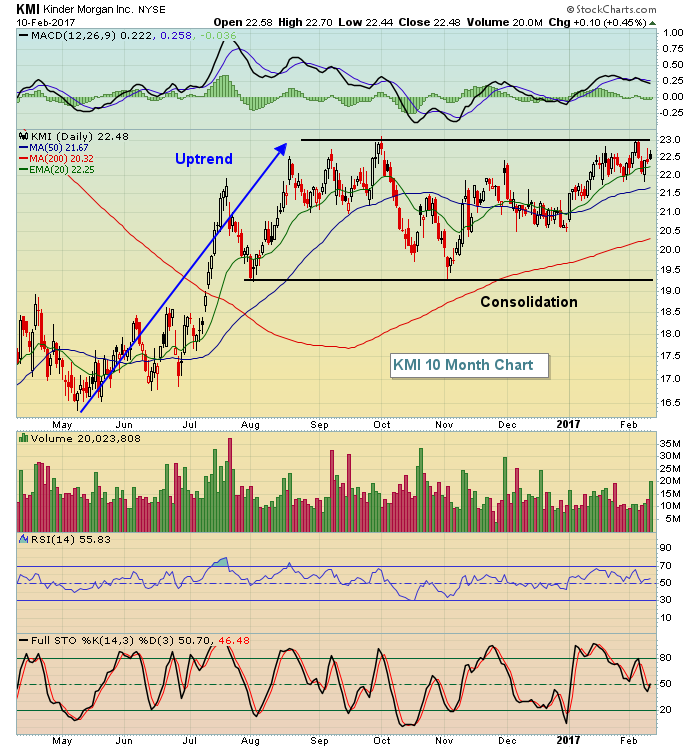 KMI has struggled recently near 23 and if you look at a weekly chart (not shown above), you'll see that very heavy volume began from this level in late-November of 2015. So a break of this trading range would be best if accompanied by very heavy volume.
Historical Tendencies
Historically, I suppose we should enjoy the next few calendar days. Beginning on February 16th (Thursday), the NASDAQ enters a one week period (February 16th through February 22nd) where it's produced annualized returns of -30.12% since 1971.
Key Earnings Reports
(actual vs. estimate):
FDC: .34 vs .30
ON: .32 vs .23
QSR: .44 vs .42
TEVA: 1.36 vs 1.32
(reports after close, estimate provided):
ACGL: 1.01
SCI: .42
VNO: 1.31
Key Economic Reports
None
Happy trading!
Tom
