Market Recap for Wednesday, February 15, 2017
Healthcare (XLV, +1.08%) resumed its leadership role but relative performance in this sector has been quite weak since the summer. Below is a chart that shows a ratio of the XLV to the S&P 500. If you've been buying and holding this sector, you've experienced underperformance and that's not unusual during bull markets. Since August 1, 2015, the XLV is down just slightly on an absolute basis, but on a relative basis it's been very weak. Check it out:
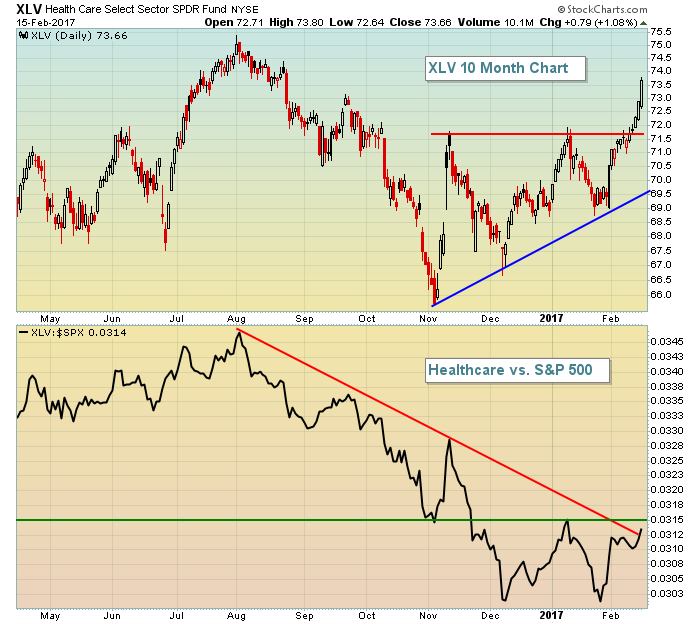 Healthcare is a boat simply being lifted by a rising tide. We have seen relative strength in healthcare over the past few weeks, but there's much more work to be done before I'd commit to the group. At a minimum, we need to see the January relative high at .0315 cleared. Without that, there's little chance of a significant relative rise in the group. Biotechs ($DJUSBT) showed strength in the sector on Wednesday and this is a group that can move very rapidly so look to the DJUSBT if you're in the XLV right now. For those willing to take on more risk, I'd look directly at some of those biotech stocks. Celgene (CELG) stands out technically to me.
Consumer staples (XLP, +0.91%) is another defensive sector that helped to fuel Wednesday's rally. While a few days of leadership from defensive areas isn't a bad thing, we don't want to see a pattern develop.
Energy (XLE, -.039%) was the weakest sector once again. Crude oil ($WTIC) continues to hover above key support so I remain ok with the energy space, but I'd look for more relative strength sooner rather than later.
Pre-Market Action
There was a lot of economic strength reported this morning, but the U.S. market is very extended in the near-term with overbought RSIs and stochastic. As a result, a bit of profit taking has left Dow Jones futures down 36 points with 30 minutes left to the opening bell.
The 10 year treasury yield ($TNX) has been trending higher the past week or so, but its taking a break this morning with the TNX down slightly to 2.48% at last check.
Current Outlook
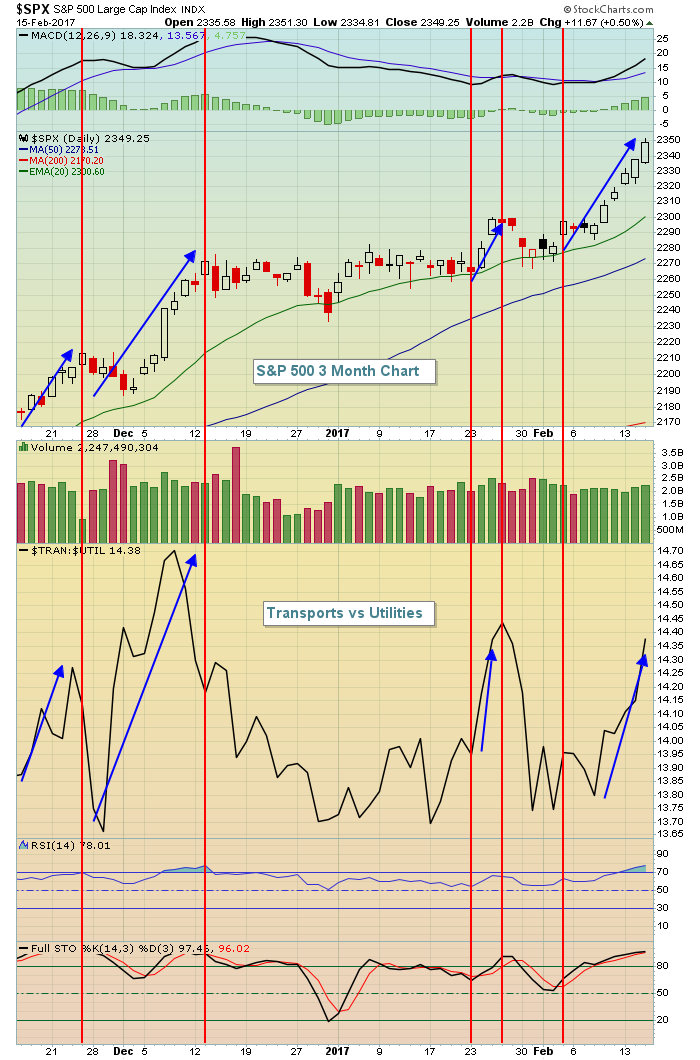
The stock market remains poised to sustain the current rally based on many of the "beneath the surface" signals that I routinely watch. Money has continued to flow into aggressive areas of the market and that's an indication that traders are in "risk on" mode, a necessary component to any bull market. The latest rise in our major indices has resulted in daily all-time highs - most definitely a wide participation advance. In addition, transportation stocks ($TRAN) have been wildly outperforming utilities ($UTIL) during the advance. That normally happens when the market is anticipating improving economic conditions ahead. That drives interest rates higher which, in turn, is the catalyst for a weakening utilities group where many high dividend yielders don't look nearly as attractive with treasury yields rising. Check out the rising TRAN:UTIL ratio that is accompanying the corresponding rise in the benchmark S&P 500:
 I start to worry when the S&P 500 rises and is led by defensive areas over an extended period of time. I really haven't seen much of that lately so I'll remain bullish. Reviewing sector performance relative to the S&P 500 is very important to gauge traders' willingness to take risks. In my Tuesday blog article, I provided a video link to my Monday Bowley Briefing webinar where I detailed the various sector's relative performance and how it remains bullish. In my Trading Places webinar a half hour later, I described the differences that were in place at the market top in 2007 and attempted to provide a link to that webinar. The video wasn't posted at the time, so I will provide you that link. Just CLICK HERE to watch what transpired back in 2007. I think you'll see the differences in a few of the "beneath the surface" signals that I follow.
The Trading Places webinar is a members-only webinar, so if you're not a member, simply sign up for a FREE 10 day trial first to check it out.
Sector/Industry Watch
Has the retail group finally started its move? Recently, I pointed out the historical tendencies of the retail group (XRT) where February has clearly been its best month of the calendar year. If you haven't seen it, I'm providing it again today in the Historical Tendencies section below. But check out the current technical picture for retail stocks below:
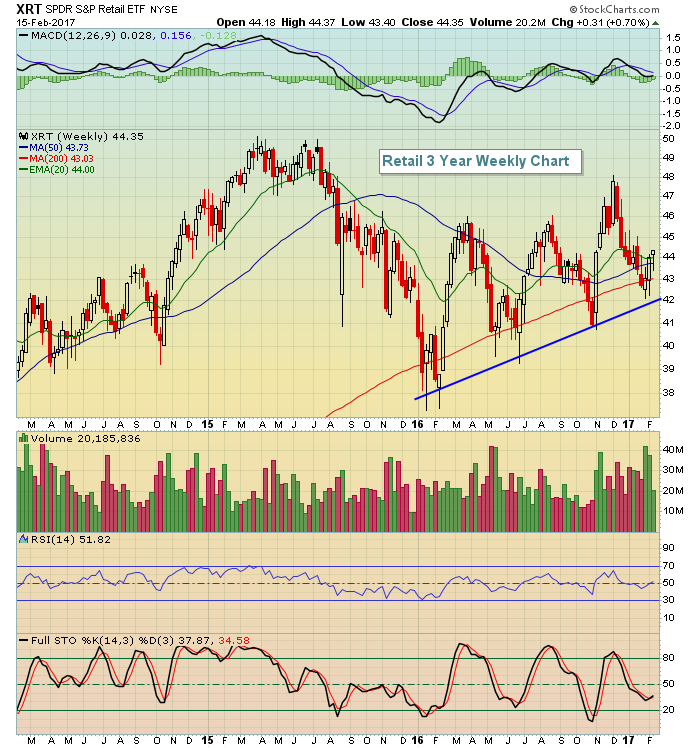 While February didn't get off to a great start, the XRT did manage a successful test of its rising trendline and is now poised for a continuing rally.
Historical Tendencies
Here's a refresher on the excellent historical performance of the XRT during February:
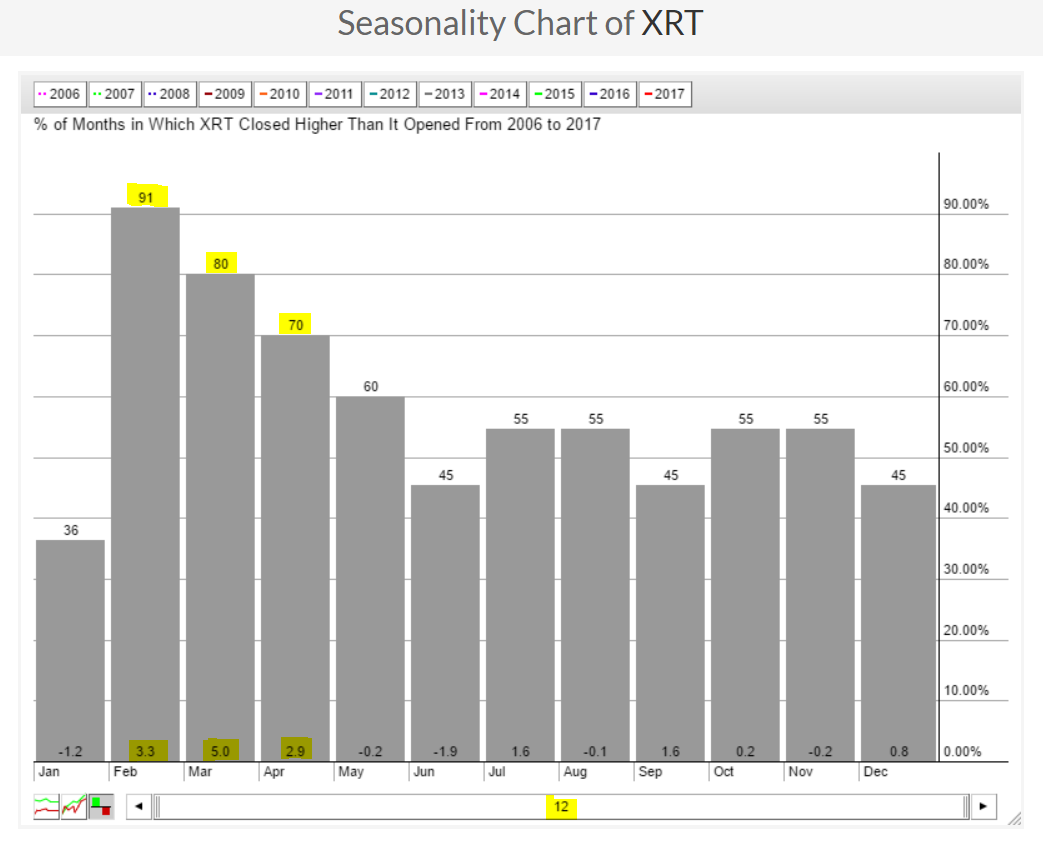 Over the past 12 years, retail has dominated from February through April. Another way to look at this seasonal outperformance is to compare the XRT to the benchmark S&P 500 in the above historical format. Here's what that looks like:
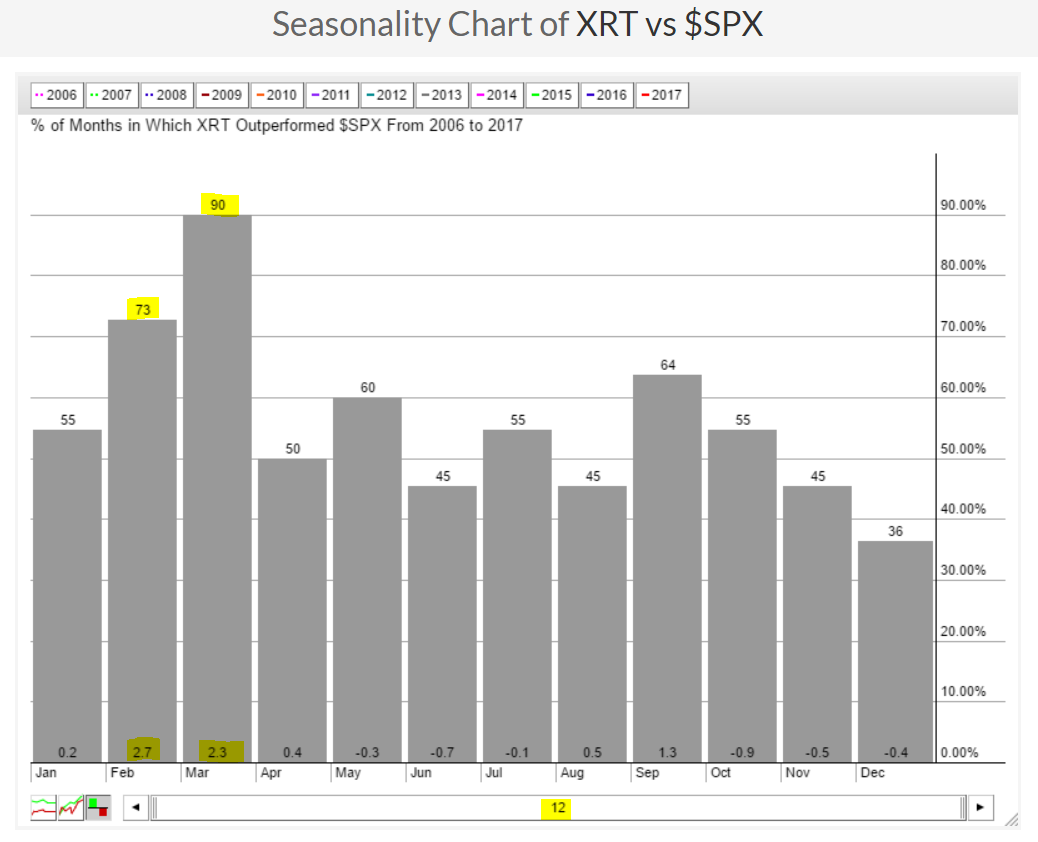 So let me explain what this chart tells us. If we focus on the February bar, this charts says that during the month of February over the past 12 years, the XRT has outperformed the S&P 500 73% of the years by an average margin of 2.7%. The outperformance during March is perhaps even more pronounced.
Key Earnings Reports
(actual vs. estimate):
Zacks has not reported actual numbers for several of the companies below.
AXLN: 1.10 vs 1.10
CHTR: vs 1.06
DUK: vs .81
ECA: .09 vs .03
FTS: .48 vs .36
LH: 2.15 vs 2.12
MGM: vs .17
WM: vs .77
ZTS: .47 vs .45
(reports after close, estimate provided):
ANET: .67
DVA: .91
ED: .65
Key Economic Reports
January housing starts released at 8:30am EST: 1,246,000 (actual) vs. 1,232,000 (estimate)
January building permits released at 8:30am EST: 1,285,000 (actual) vs. 1,233,000 (estimate)
Initial jobless claims released at 8:30am EST: 239,000 (actual) vs. 246,000 (estimate)
February Philadelphia Fed Survey released at 8:30am EST: 43.3 (actual) vs. 19.3 (estimate)
Happy trading!
Tom
