Market Recap for Wednesday, May 24, 2017
Seven of nine sectors finished higher to lead the S&P 500 to a record high close on Wednesday. Materials (XLB, +0.67%) and utilities (XLU, +0.57%) led the advance as gold mining ($DJUSPM) and mining ($DJUSMG) both performed extremely well, rising 1.58% and 1.20%, respectively. Steel ($DJUSST) was one of two industry groups in the materials sector to finish lower, failing to hold a breakout above its declining 20 day EMA. The DJUSST could be set up for further losses unless we can establish a close back above that key moving average.
Energy (XLE, -0.53%) was easily the worst performing sector despite a very strong renewable energy group ($DWCREE, +4.82%). All of the remaining industry group components in energy finished lower, however.
Pre-Market Action
Dow Jones futures are on the rise again, this time higher by 69 points just 30 minutes prior to the opening bell. The all-time high close on the Dow is 21115, which is something to watch in today's action.
Current Outlook
The S&P 500 closed at another all-time high on Wednesday and appears poised for further gains. The daily MACD is turning higher on this move, as opposed to its last all-time high where the MACD was rolling over - a signal of slowing momentum. After that top, the S&P 500 dropped back below its 50 day SMA and reset its MACD just below centerline support. Since then, however, we've seen our major indices recover as we enter a historical bullish period from May 26th (tomorrow) to June 5th. Here's the current technical view:
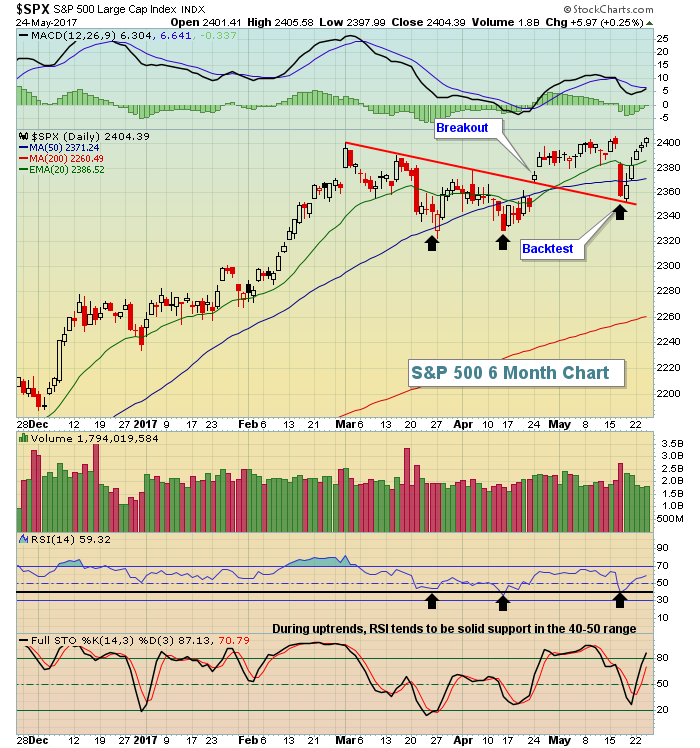 One word of caution. There is a negative divergence on the S&P 500's weekly chart and the rising 20 week EMA is currently at 2343. So that 20 week EMA, along with the double bottom price support above near 2325, provides a key support range. If that's violated, we could see a much larger selloff, but for now I'll remain bullish.
Sector/Industry Watch
The Dow Jones U.S. Broadcasting & Entertainment Index ($DJUSBC) has been one of the best performing industry groups within consumer discretionary over the past week, but it's now facing key short-term price and 20 day moving average resistance. This industry houses one of the underperforming components of the Dow Jones, Walt Disney Co. (DIS), which has seen price/volume action turn quite bearish over the past four weeks. Here's the current technical obstacles for the group as we wrap up May:
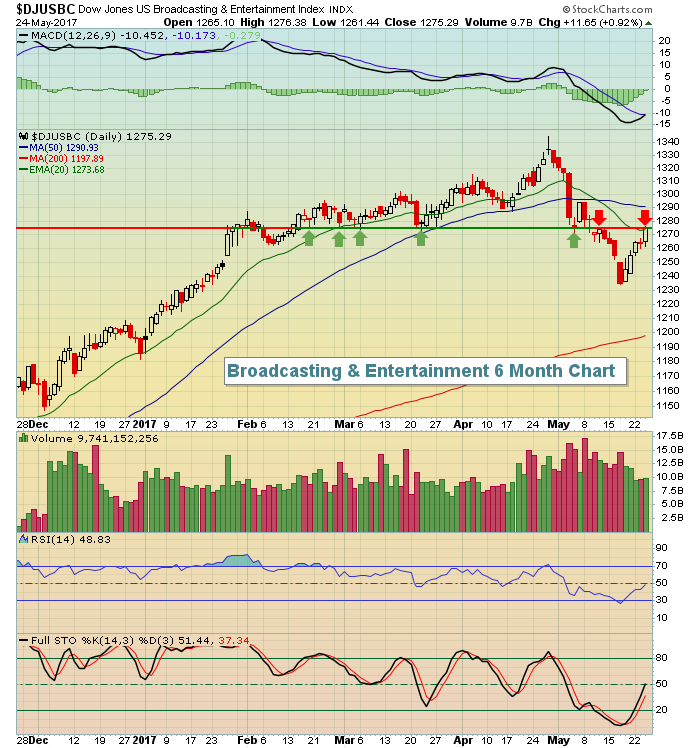 There were at least five separate tests of price support (green arrows) from February through early May before the DJUSBC finally broke down. At that same time, the daily MACD made a bearish centerline cross and fell precipitously. While we've seen great strength from this group over the past week, we're now at a very important technical level as the DJUSBC closed barely above its 20 day EMA, but literally right on price resistance.
Historical Tendencies
The DJUSBC was featured above under the Sector/Industry Watch section. It faces technical headwinds and it also could struggle with the month of June, which is historically weak:
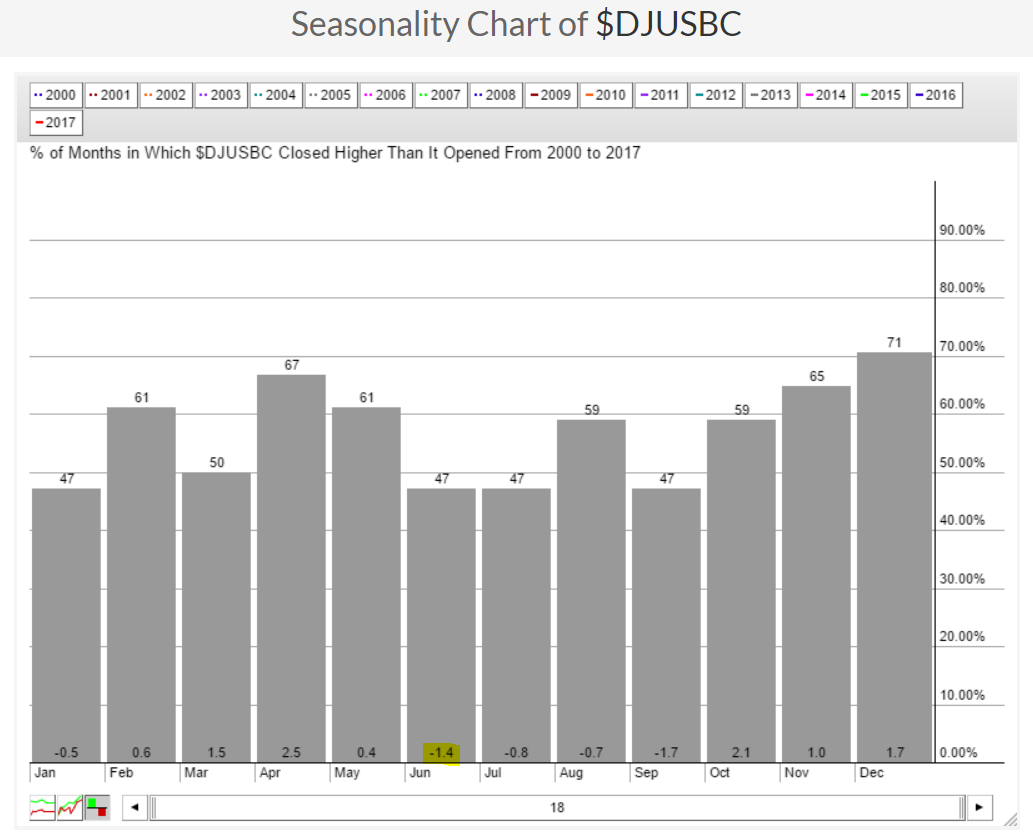
Over the past 18 years, the DJUSBC has averaged dropping 1.4% and given the technical issues currently, June 2017 may pose problems as well.
Key Earnings Reports
(actual vs. estimate):
BBY: .60 vs .40
BURL: .73 vs .70
CM: 1.99 vs 1.87
DLTR: .98 vs .99
HRL: .39 vs .40
MDT: 1.33 vs 1.31
RY: 1.33 (est)
(reports after close, estimate provided):
COST: 1.31
MRVL: .16
SPLK: (.75)
ULTA: 1.79
VEEV: .12
Key Economic Reports
Initial jobless claims released at 8:30am EST: 234,000 (actual) vs. 237,000 (estimate)
Happy trading!
Tom
