Market Recap for Tuesday, March 20, 2018
There weren't huge gains on Tuesday, but given how poorly Monday went, I'd say yesterday was a very solid day. On Monday, we saw the Volatility Index ($VIX) spike more than 20% back above 19 as fear ramped up. The Dow Jones lost 335 points. The more aggressive NASDAQ Composite lost 137 points (-1.84%) in what had to be considered its worst day since it closed down 275 points on February 8th to close at its 2018 low. On February 9th, we saw the NASDAQ tumble another 147 points intraday before reversing and closing in positive territory. With the VIX back on the move higher Monday, the NASDAQ certainly was set up for possibly another big down day. Instead, that selling never really materialized and the NASDAQ traded in a relatively quiet 50 point range throughout the session, ending with a 20 point gain. Not bad.
There were definitely pockets of significant relative weakness, however. Internet stocks ($DJUSNS) remained under selling pressure as Facebook (FB) closed at its lowest level in nearly six months. Volume? Off the charts....take a look:
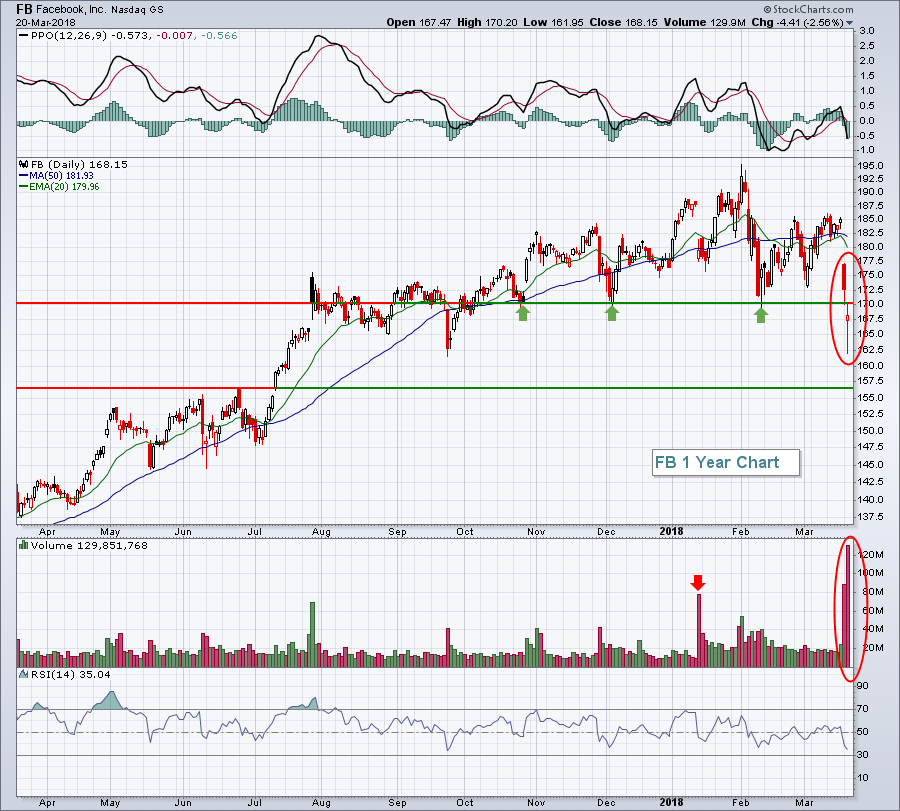 This isn't rocket science folks. FB has fallen nearly 10% in two days on its two heaviest volume days of the last year. Tuesday's 129 million shares was the highest since early-2014. There's a very good chance that big money is cashing in its chips on FB. If you're looking for a silver lining, it's the long-term uptrend channel that continues to hold.....for now:
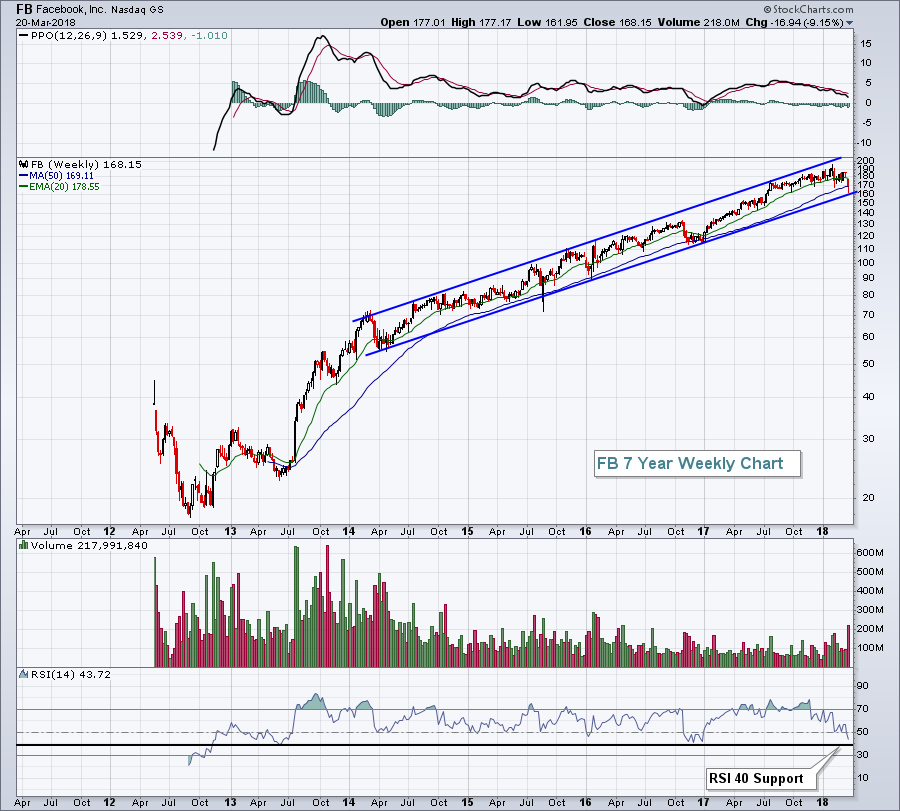 Even long-term investors should be concerned if FB loses its channel support near the 160 level, especially is this unusually heavy volume confirms that breakdown. Before you point out that this week's volume is low relative to what we saw from 2012 to 2014, consider that (1) this week's volume only includes Monday and Tuesday. We still have three more days to go this week. And (2) consider DOLLAR volume. Facebook is much more expensive now than it was back in 2012 to 2014. Do the math and you'll realize there's a bunch of money dumping FB stock right now.
Energy (XLE, +0.85%) was Tuesday's leading sector, but it finished well off earlier intraday highs so even it's one day leadership was completely uninspiring. Crude oil ($WTIC) has been rising, however, so the XLE should have another chance or two to clear very important 20 day EMA resistance, currently at 67.44. The XLE hit 67.28 intraday, but closed at 66.83.
Technology (XLK, -0.04%) struggled on Tuesday as the weak internet space ($DJUSNS) held back this aggressive sector. However, the weakest sectors once again belonged to the defensive utilities (XLU, -0.46%) and consumer staples (XLP, -0.28%). Traders are not yet willing to dump aggressive sectors en masse and that bodes well for 2018 stock market performance - in my opinion.
Pre-Market Action
The 10 year treasury yield ($TNX) is back to 2.90% ahead of the latest FOMC policy statement, due out at 2pm EST today. Crude oil ($WTIC) is rising this morning and has cleared $64 per barrel at last check.
Asian markets were mostly lower overnight, as are European markets this morning. U.S. futures are also showing slight weakness with Dow Jones futures down by 19 points with just under 30 minutes left to the opening bell.
FedEx Corp (FDX) is looking to open relatively flat after reporting its quarterly results after the closing bell on Tuesday.
Current Outlook
Consumer discretionary (XLY) has been one of the best performing sectors since its early-November relative bottom. It recently broke out of a bullish symmetrical triangle pattern and now is looking to regain its relative strength after consolidating in recent weeks. Here's my current technical view of the XLY:
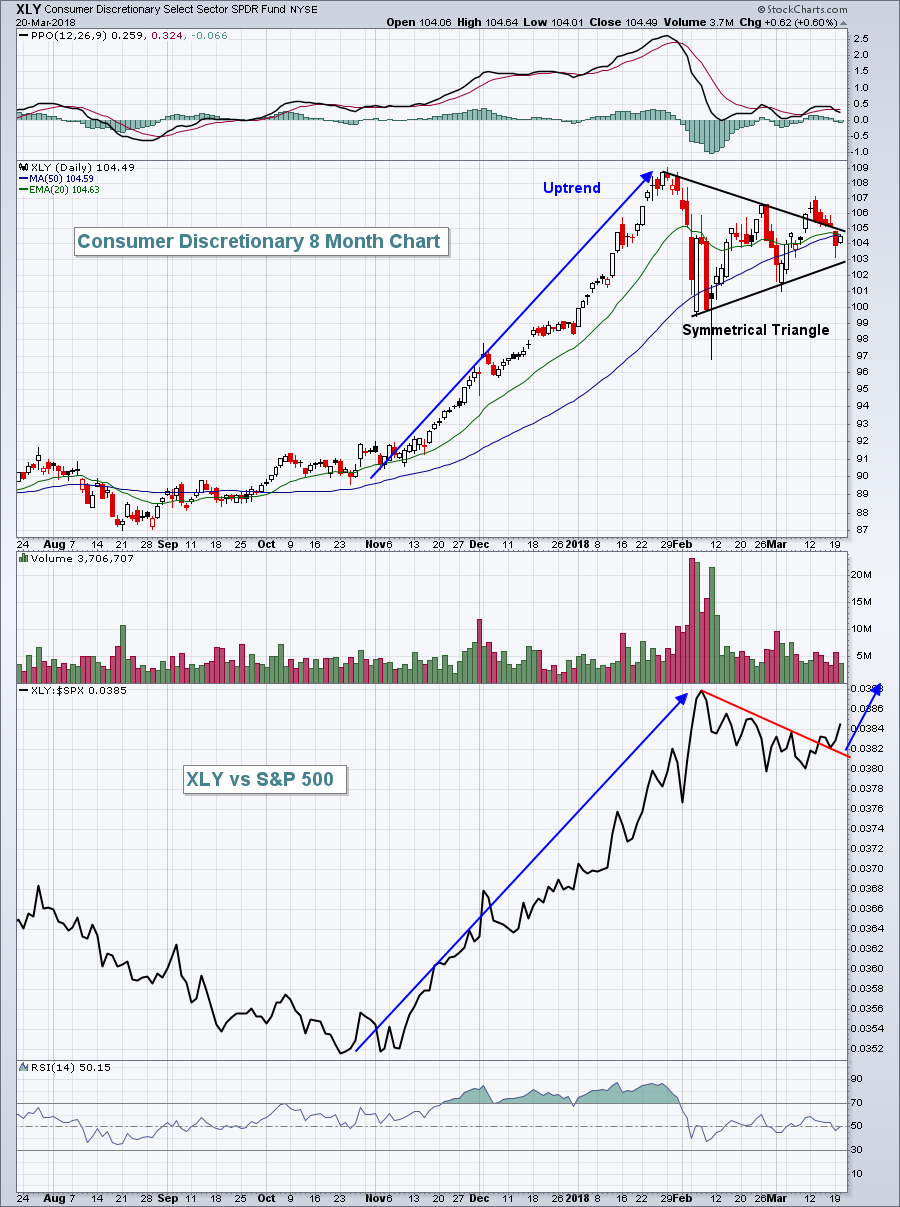 Ok, there are a few takeaways from this chart for me. The triangle breakout occurred on lighter than normal volume, a negative. And, honestly, drawing triangle lines is quite subjective, similar to trendlines. We could draw a line connecting the tops in late January and the recent high near 107 and have a new triangle, right? So we need to be careful how much weight we give these patterns. A breakout should literally explode off the chart and this one didn't do that. I do like a number of things on this chart, though.
Among the bullish indications are: (1) overbought conditions from late January have been relieved. RSI readings were in the upper 80s and unsustainable in my view. The RSI is now at 50 with a PPO that's been hovering near its centerline for the past six weeks. Consolidation is exactly what this market, and XLY specifically, has needed. (2) The XLY is beginning to strength again on a relative basis. Check out the XLY:SPX ratio above. It's at its highest relative reading in a month and leadership in this aggressive area of consumer stocks has been very bullish for equities for the past two decades. (3) The moving averages are converging, another sign that consolidation could be complete.
I remain very bullish and look for consumer discretionary stocks to lead the next rally in our major indices.
Sector/Industry Watch
The Dow Jones U.S. Gambling Index ($DJUSCA) is on the move again. It recently broke out of its bullish wedge and appears poised for further gains. I'd be willing to "bet" that we'll see a breakout to fresh new highs sometime over the next 5-6 weeks based on its technical indications and a strong seasonal period. First, let's take a look at the chart:
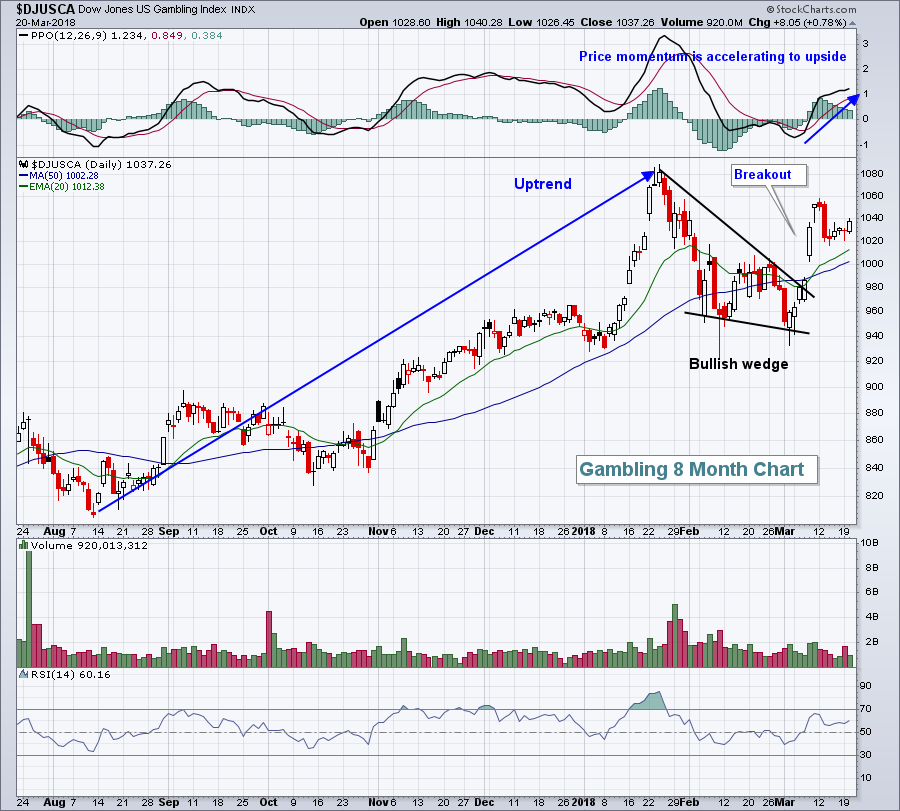 While the technical outlook appears quite bullish indeed, that's only half the story here. Over the past 19 years, the DJUSCA has averaged gaining 3.4% and 6.7% during the months of March and April, respectively. That is, by far, the best two consecutive months of the year for gambling stocks. The next best consecutive month period is October and November, which average 2.0% and 2.2%, respectively. Like I said, it's not even close.
Historical Tendencies
Internet stocks ($DJUSNS) have taken a beating of late, thanks in large part to Facebook (FB). But two internet stocks are the best seasonal performers in the NASDAQ 100 in April and May so this recent weakness could be providing an opportunity for lower entry. For more details, check out my latest ChartWatchers article "Here Are Two Seasonal Winners In The NASDAQ 100 For April And May".
Please be sure to subscribe to ChartWatchers if you haven't already. There are a number of ways to do so. At the bottom of your Member Dashboard (home page), there's an area to sign up for ChartWatchers. If you click on the "Blogs" tab and scroll down, you'll see a ChartWatchers sign up on the right side of the page. Finally, if you CLICK HERE, there's a "Subscribe to ChartWatchers" button just beneath the "About This Blog" section at the top of the page.
ChartWatchers is a FREE newsletter that is published the first and third weekends of every calendar month and keeps you up-to-date on the latest technical developments. You'll get the latest thoughts of John Murphy (invaluable), Arthur Hill, yours truly and other expert technicians to help you manage your investments. And did I mention it's FREE??? If you're not already a ChartWatchers subscriber, the next step you take should be to become one. :-)
Key Earnings Reports
(actual vs. estimate):
GIS: .79 vs .79
Key Economic Reports
February existing home sales to be released at 10:00am EST: 5,420,000 (estimate)
FOMC policy statement to be released at 2:00pm EST
Happy trading!
Tom
