| THIS WEEK'S ARTICLES |
| John Murphy's Market Message |
| STOCKS REBOUND FROM FROM OVERSOLD CONDITION |
| by John Murphy |
S&P 500 ENDS THREE-WEEK DECLINE... Stocks are ending the week on a strong note after falling for the previous three weeks. An oversold condition and the presence of underlying chart support are also playing a role in this week's buying. The 9-day RSI line in the upper box is bouncing from oversold territory below 30 for the first time in three months. In addition, the chart shows the SPX bouncing off its 62% Fibonacci retracement line measured from its June bottom to its August top. That positive combination has helped push the SPX back above its 50-day moving average which also strengthens its short-term trend. Having said that, the SPX remains well below its falling 200-day moving average (red arrow) which measures the market's long term trend and which remains bearish. Until that situation changes, technical odds favor this week's stock rebound being a short-term rebound in a larger downtrend.
FIBONACCI RESISTANCE... The horizontal lines in Chart 2 show overhead Fibonacci lines measured from the August high to this week's low which show where the market's rebound could run into new selling. The most important of the three lines is the upper 62% retracement line. A price move above that upper line would signal a more substantial rally.
 Chart 1 Chart 1
 Chart 2 Chart 2
COMMODITIES REMAIN IN DOWNTREND... With all the attention on the direction of inflation, it's worth keeping an eye on the direction of commodity prices. That's because commodity prices often act as a leading indicator of inflation at the producer and consumer levels. And the current trend is down. The daily bars in Chart 3 show the S&P GSCI Commodity Index having fallen to the lowest level in seven months. There's good and bad news in that lower trend. The good news is that falling commodity prices suggest that inflation may actually be peaking. The bad news is that commodity prices have a history of peaking in the early stages of a recession after the Fed starts raising interest rates. A strong dollar may also be putting downward pressure on commodity prices.
 Chart 3 Chart 3
A LOOK AT THREE ENERGY MARKETS... Energy prices play a major role in the direction of commodity prices and inflation in general. And the news may be encouraging. In order to get a better read on that trend, however, it's necessary to look at the individual components within the energy patch. Chart 1 shows the United States Oil Fund falling below its 200-day moving average this week before rebounding sharply on Friday. The USO has fallen -27% since June. Chart 5 shows the United States Gasoline Fund falling below its 200-day average to the lowest level since February having lost -37% of its value. That's good news for drivers. A lot of attention is also being paid to the trend of natural gas. Chart 6 shows the United States Natural Gas Fund pulling back over the last month but remaining above its 50-day moving average. So far, the price of natural gas has held up better than other parts of the energy complex. Shortages of nat gas in Europe have already pushed its price sharply higher there. It remains to be seen if that does the same to prices here.
 Chart 4 Chart 4
 Chart 5 Chart 5
 Chart 6 Chart 6
|
| READ ONLINE → |
|
|
|
| Art's Charts |
| Energy-based ETFs Hold Up Despite Weakness in Stocks and Oil |
| by Arthur Hill |
It has been a rough four weeks for stocks and oil, but the energy-related ETFs held up relatively well and remain in uptrends. The PerfChart below shows performance for SPY, oil, the DB Energy ETF (DBE) and five energy-related ETFs since August 16th, which is when SPY peaked. SPY is down around 6.8%, oil is down 3.5% and DBE is down 4.3%. One would expect the energy-related ETFs to also be down, but four of the five are up.
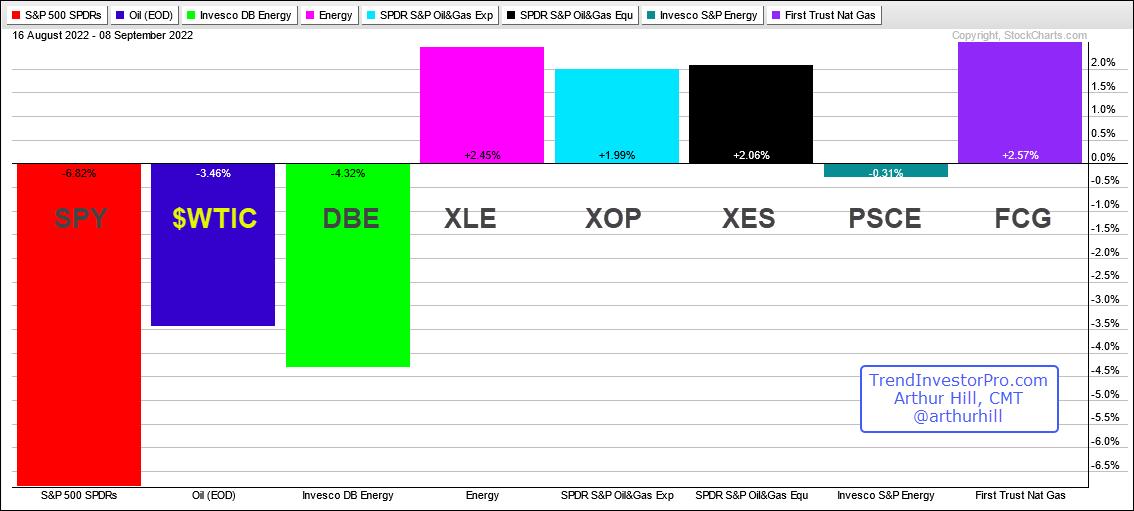
The Energy SPDR (XLE) and Natural Gas ETF (FCG) are leading because they are up around 2.5%. The Oil & Gas Equipment & Services ETF (XES) and Oil & Gas Exploration & Production ETF (XOP) are up around 2% and holding up better than the broader market. The Small-cap Energy ETF (PSCE) is down around .31% and lagging the other four.
The next chart shows the Energy SPDR (XLE) with the Trend Composite turning positive (lower window). There was a whipsaw signal in the second half of July because the pullback was quite deep. These happen. On the price chart note that XLE managed to firm after retracing around 61.8% of the December-June advance and broke short-term resistance on July 20th (red line). The Trend Composite followed with a bullish signal.
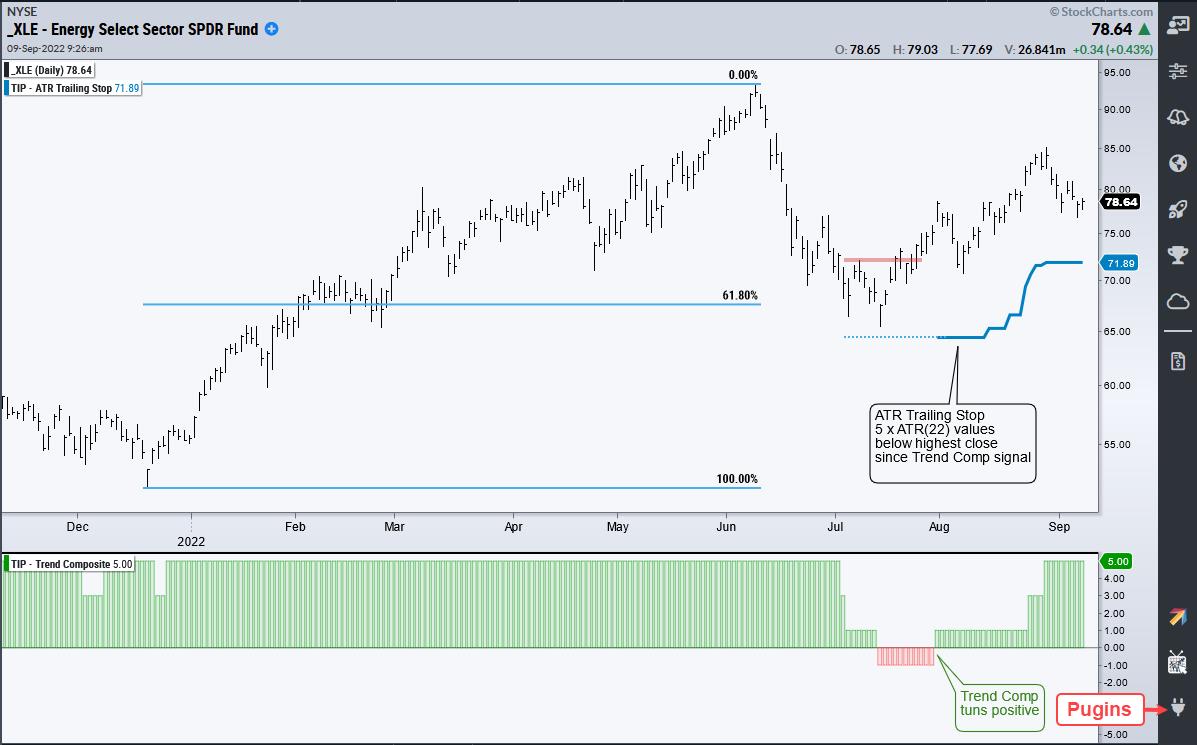
The blue line on the chart is the ATR Trailing Stop, which can be used to set a stop-loss after a signal. Using the Trend Composite signal, I set the initial ATR Trailing Stop just below the July low, which is support (dotted line). A 5 x ATR(22) stop means the stop is five ATR(22) values below the highest close since the signal. This stop rises when prices rise and flattens when prices decline, as in the last two weeks. A close below the stop or negative Trend Composite would warrant a re-evaluation. See the "plugin" link in the lower right to learn more about the Trend Composite and ATR Trailing Stop.
TrendInvestoPro remains very selective when it comes to stock-based ETFs because the broad market environment remains bearish. ETFs in favor include energy, clean energy, utilities and biotechs. In fact, we identified some short-term bullish continuation patterns this week in XLE, TAN, ICLN, XLU, XBI and IBB. Click here for immediate access to around reports, videos and strategies.
The StochClose, the Trend Composite, ATR Trailing Stop and eight other indicators are part of the TIP Indicator Edge Plugin for StockCharts ACP. Click here to take your analysis process to the next level.
---------------------------------------
|
| READ ONLINE → |
|
|
|
| The Canadian Technician |
| Is Crypto Finally Moving Higher? |
| by Greg Schnell |
Crypto has been Kryponite for investors since November 2021. The holders (HODL - Hold On for Dear Life) have been hammered. Recently, crypto has started to behave better including going sideways, while the stock market pulled back in late August.
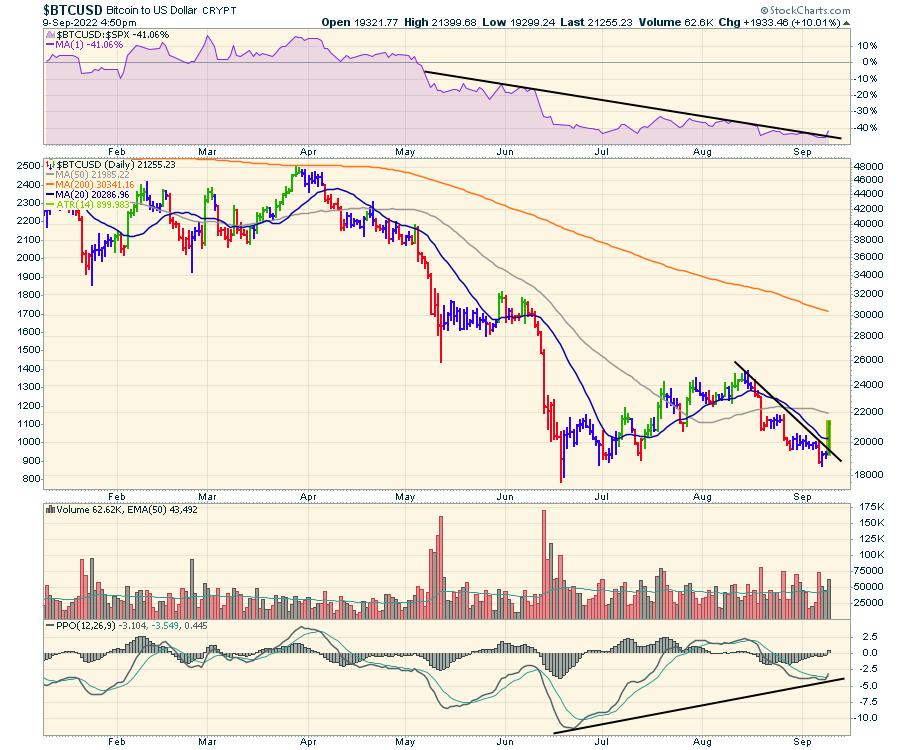
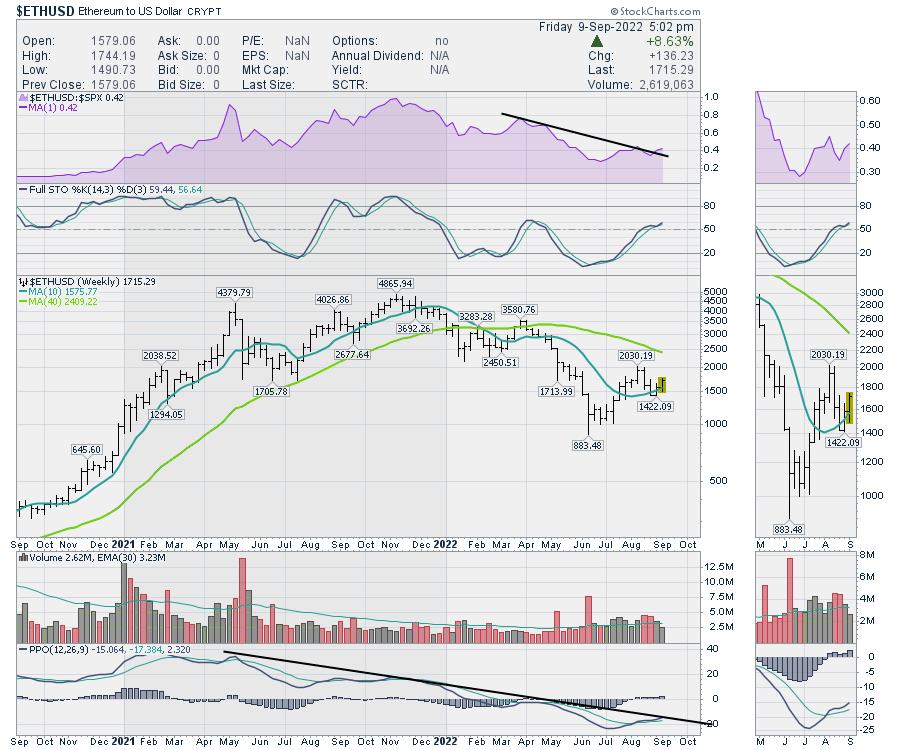
(In the charts below, the daily version has a yellow background, while the weekly has a graphite background.)
Bitcoin ($BTCUSD) is the most common chart. On Friday, the chart fired off like a rocket heading higher, breaking the smooth downtrend it was building.
A few bullish things I see on the chart:
- The relative strength to the $SPX (RS) is breaking the downtrend.
- On a wider scale, this is also a double bottom location with the June/July lows.
- The PPO is making a significantly higher low than the June low.
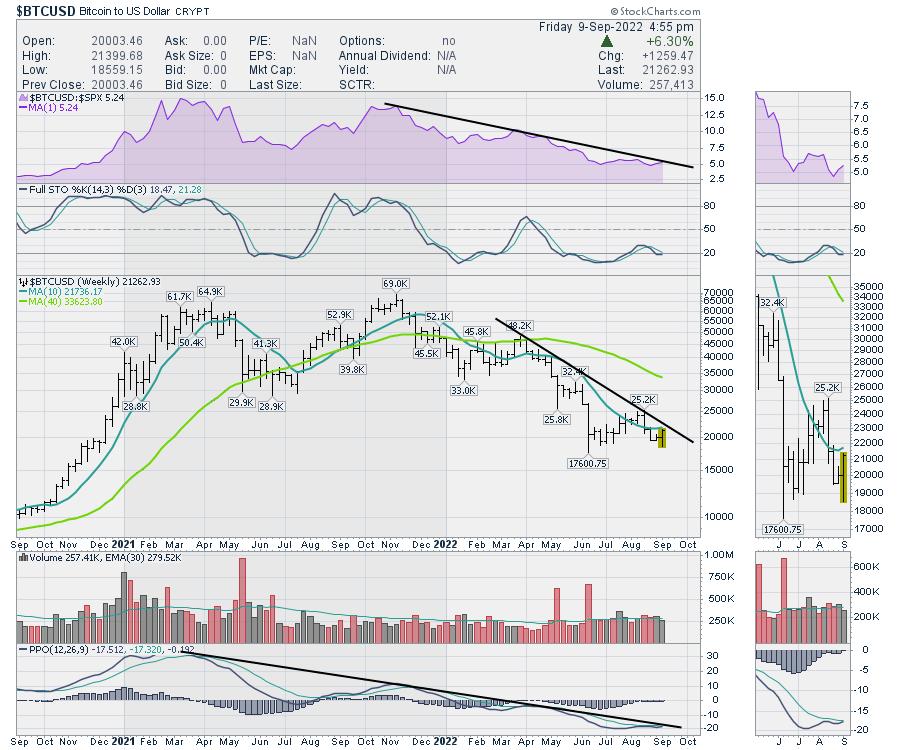
Going to the weekly chart, Bitcoin has a few things I like to see as well, but they haven't flipped a signal yet.
- The Purple RS is close to breaking the downtrend.
- The full stochastic looks like a higher low and is trying to move above the 20% line and the signal line.
- The PPO shows the momentum hitting a high in February 2021. Can it break out of the PPO downtrend?
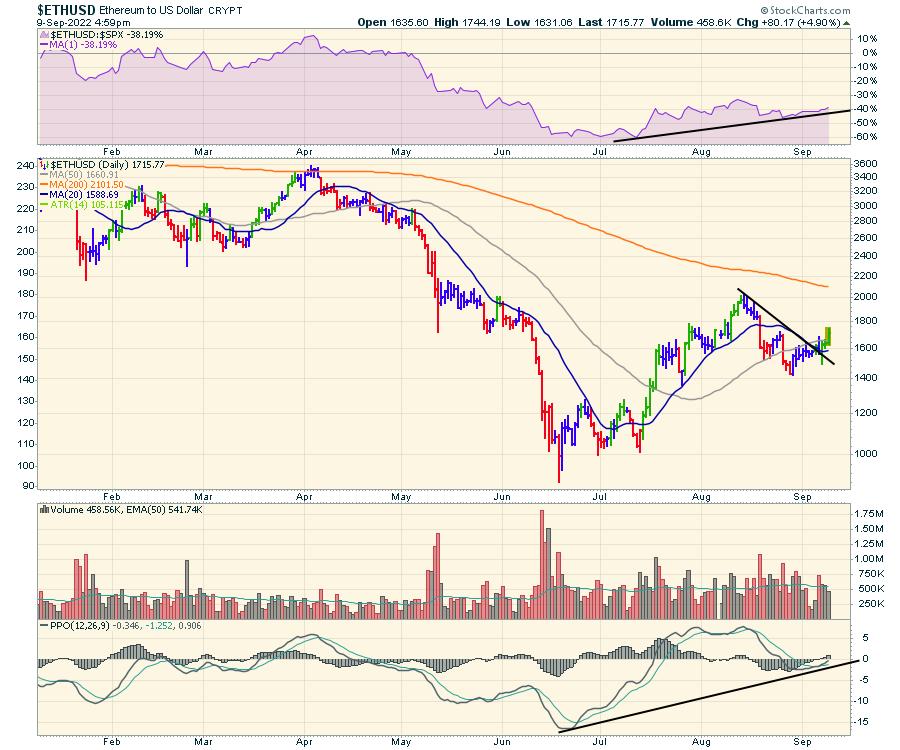
Ethereum has a few of the same clues forming:
- The RS has been trending higher since July.
- Price broke the downtrend a week ago.
- Price is making a much higher low whereas Bitcoin was making a double bottom.
- Price has a series of higher lows.
- The PPO has a much higher low than the June low and is almost in positive territory.
The Ethereum Weekly chart is also improving:
- The RS line is breaking out!
- The full stochastic is restarting a move above 50%, which is very bullish on a weekly chart.
- Price is making a 3-week high.
- The 10-week moving average is looking like support here.
- The PPO downtrend is close to breaking.
- The PPO is already on a buy signal!
If we are looking for a turning point, these charts look to be ready. It's been a tough drop off the highs, but the opportunity might be here for the next wave higher.
I'll be hosting a presentation on September 20th at 1 PM ET. The purpose of the presentation is to explain more about the Osprey Strategies approach to the market. Follow this link to register at Osprey Strategies.
Special Presentation
Join me, I think we'll have a lot of fun, and I am sure you'll pick up a few clues to how we perform!
|
| READ ONLINE → |
|
|
|
|
|
| The MEM Edge |
| The S&P 500 Has Traded Back Above Key Resistance - Here's What To Do Next |
| by Mary Ellen McGonagle |
The markets ended the week with a strong rally, which occurred despite hawkish comments from several Federal Reserve officials and Fed Chair Powell. Their comments further the possibility that rates will be increased by 75 basis points at their next meeting later this month, while also pointing to a prolonged path of higher rates into next year.
In response, yields rose last week, which is normally a negative for stocks. This is particularly true of Growth stocks as future earnings are reduced in value. The chart below shows the Nasdaq's response to rising rates, with last week's rally occurring despite a continued uptick in rates.
DAILY CHART OF NASDAQ ($COMPQ) WITH OVERLAY OF 10-YEAR TREASURY YIELD (TNX)
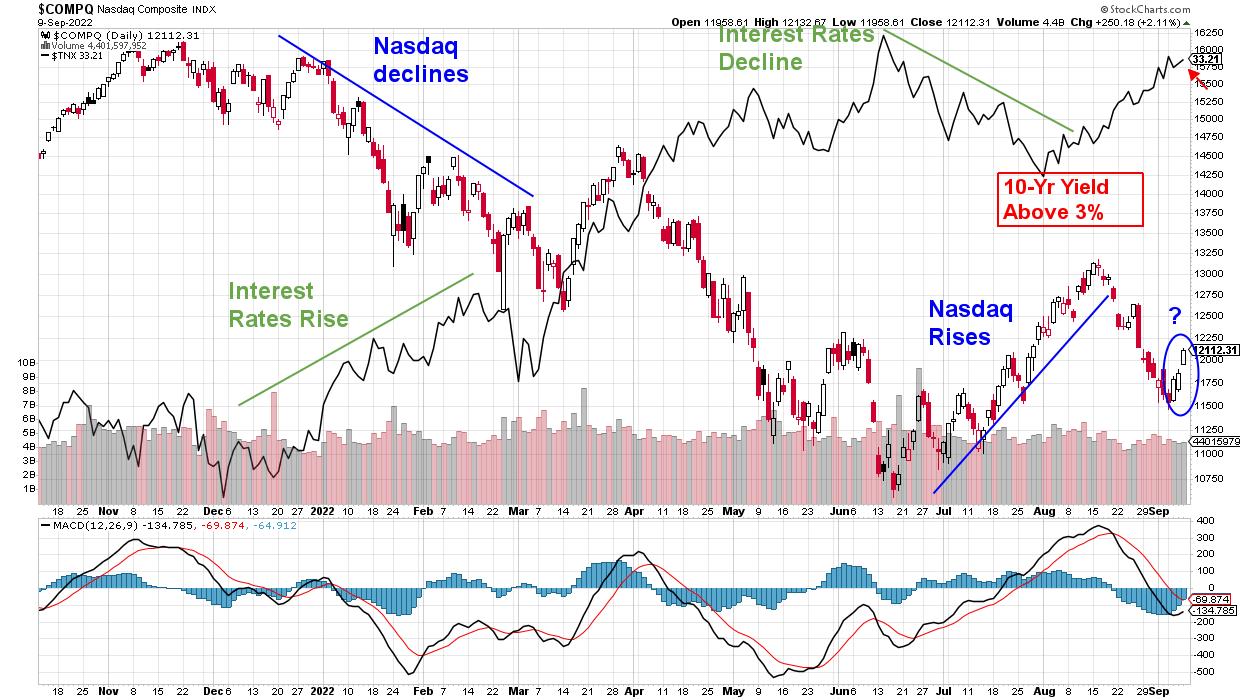
So what drove stocks higher last week in the face of a rising-rate environment? One factor is that the markets were oversold and due a bounce. Compounding this was a short squeeze, as the most shorted stocks posted gains last week that far outpaced the broader markets. The sharp gains can be seen using the Goldman Sachs Index of the most shorted stocks (which I am unable to share here).
The rally last week pushed the S&P 500 back above its 50-day moving average, which was the next area of upside resistance for this Index. While it's unclear where the markets will head from here, it's critical that you have a strategy as market conditions unfold.
If you're a longer-term investor, last week's bounce should not change your strategy, as it does not signal a major turning point. The broader markets have not reversed their bear market downtrend and will need to trade above at least their mid-August highs before this can be considered. Shorter-term investors can anticipate a bit more upside heading into Tuesday's Consumer Price Index (CPI) report and perhaps beyond; however, you'll need to keep your stops tight, as we've seen the markets reverse quickly from short squeeze rallies such as late May.
There are areas of the market that are currently poised to continue higher despite an overall downtrend, which is not unusual. Energy stocks posted sharp gains the first half of this year, while the broader markets suffered.
For more information regarding areas that are poised to trend higher during the currently difficult period, use this link to receive immediate access to my MEM Edge Report, which will provide insights as well as specific stocks. In addition, the link above will provide you with a 4-week trial of my twice-weekly report at a nominal fee. You'll receive access to a dynamic watchlist of stocks that have superior fundamentals and positive charts, as well as be alerted to when the markets shift.
On this week's edition of The MEM Edge, now available to watch on demand at StockChartsTV.com and the StockCharts YouTube channel, I review last week's rally, which pushed the markets above a key area of near-term resistance. I also share stocks from the top-performing sectors that have positive charts, with a focus on base breakouts.
Warmly,
Mary Ellen McGonagle, MEM Investment Research
|
| READ ONLINE → |
|
|
|
| Martin Pring's Market Roundup |
| Preparing for an Upcoming Bond Mini-Bull Market |
| by Martin Pring |
This may seem like a foolish title, given that the Fed could be about to raise short-term interest rates by as much as 75 basis points in September with further, but smaller, hikes following that. However, bonds revolve around the business cycle in a chronological sequence, as do stocks and commodities. All is revealed, at least in theory in Figure 1. For a more complete explanation, read this.
The green and red arrows show the cyclical lows and highs, respectively, for the three markets as they are expected to materialize in a typical business cycle. We estimate that the current one has reached a point somewhere in the pink shading. That's because our Pring Turner models have all three markets locked in a bearish mode. In addition, all three, using the CRB Spot Raw Industrials rather than the CRB Composite for commodities, are below their 12-month moving averages. If that is a correct assumption, and the markets follow the usual chronological script, the bond market should present itself as the next important buying opportunity.
Before considering the primary trend aspects in detail, a few words on the state of the secular trend are in order, since that will set the context for any buying signal that may develop in the period ahead.
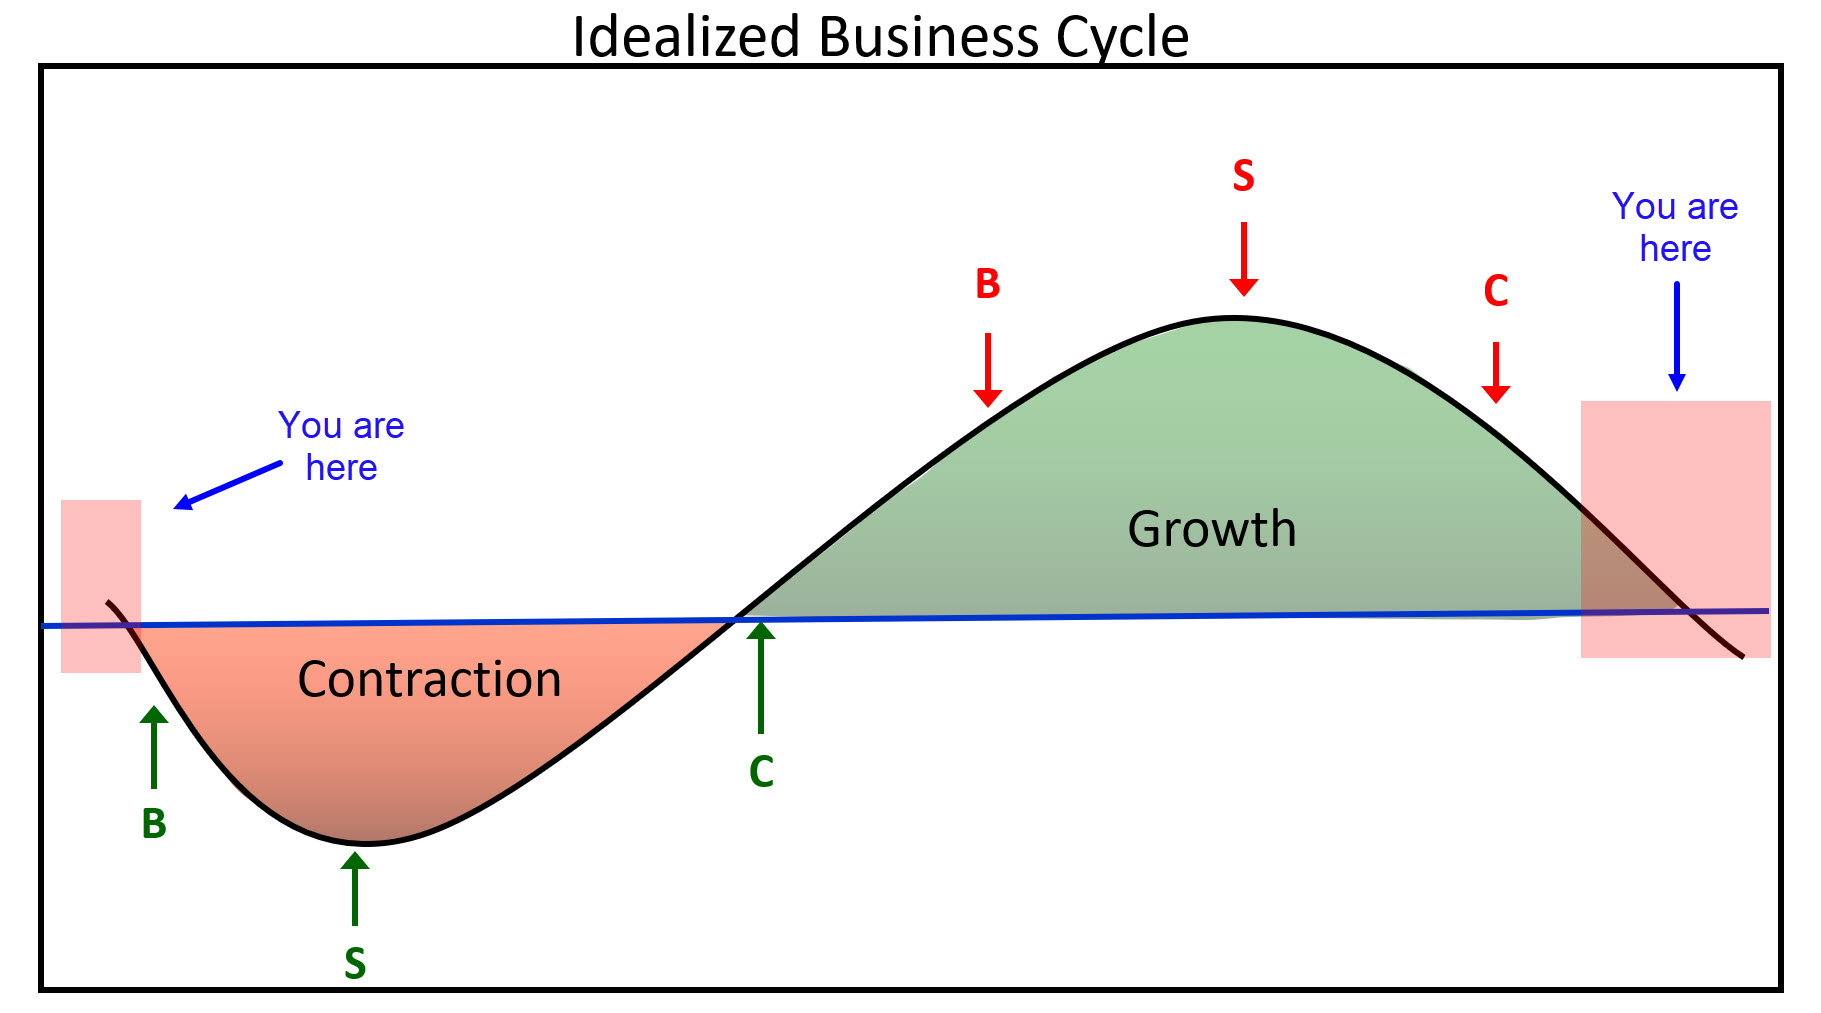 Figure 1 Figure 1
The Secular Trend
It's important to understand the direction of the secular trend, because that's what determines the characteristics of the primary trends that fall below it. Chart 1 shows that there are grounds for suspecting that the post-1981 trend of declining yields is over. First, the 30-year yield has experienced a positive 96-month MA crossover. Ignoring the 2018 whipsaw, that's the first time the MA has been ruptured since 1985. Second, the 18-month ROC recently experienced a record high. That's bullish in its own right, because it indicates huge underlying upside momentum. Furthermore, this record high was preceded by a record low following a multi-decade decline to represent what I call a bullish "extreme swing."
It's also worth noting that secular reversals since the mid-nineteenth century have been characterized by multi-year trading ranges prior to the new trend getting underway in earnest. For example, the chart shows that the reversal of the post-WWII secular decline experienced a multi-year top as part of its reversal process. If past is prologue, the impending buying opportunity that we see could well turn out to be part of a secular topping-out process for prices (as in Chart 3) or basing action for yields (Chart 1).
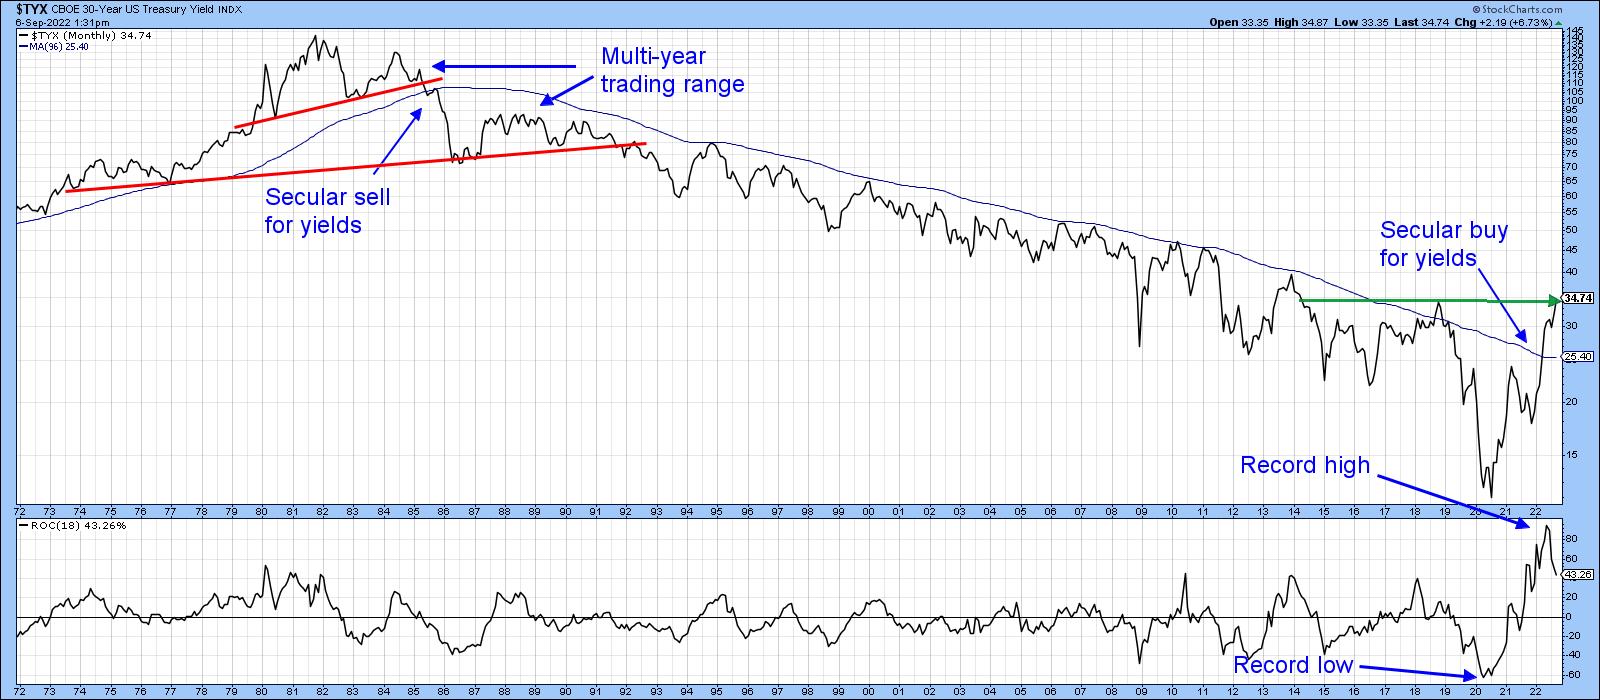 Chart 1 Chart 1
Interasset Relationships are Close to a Buy Signal for Bond Prices
One of the ways we can use the knowledge embodied in Figure 1 and identify the prevailing stage in the current cycle is to calculate ratios between the relevant asset classes, which act as a cross reference. Usually, this analysis is more helpful when these relationships are expressed in smoothed long-term momentum format. I use the long-term KST for this purpose, but there is no reason why a slowed stochastic with the right parameters or the MACD cannot be substituted.
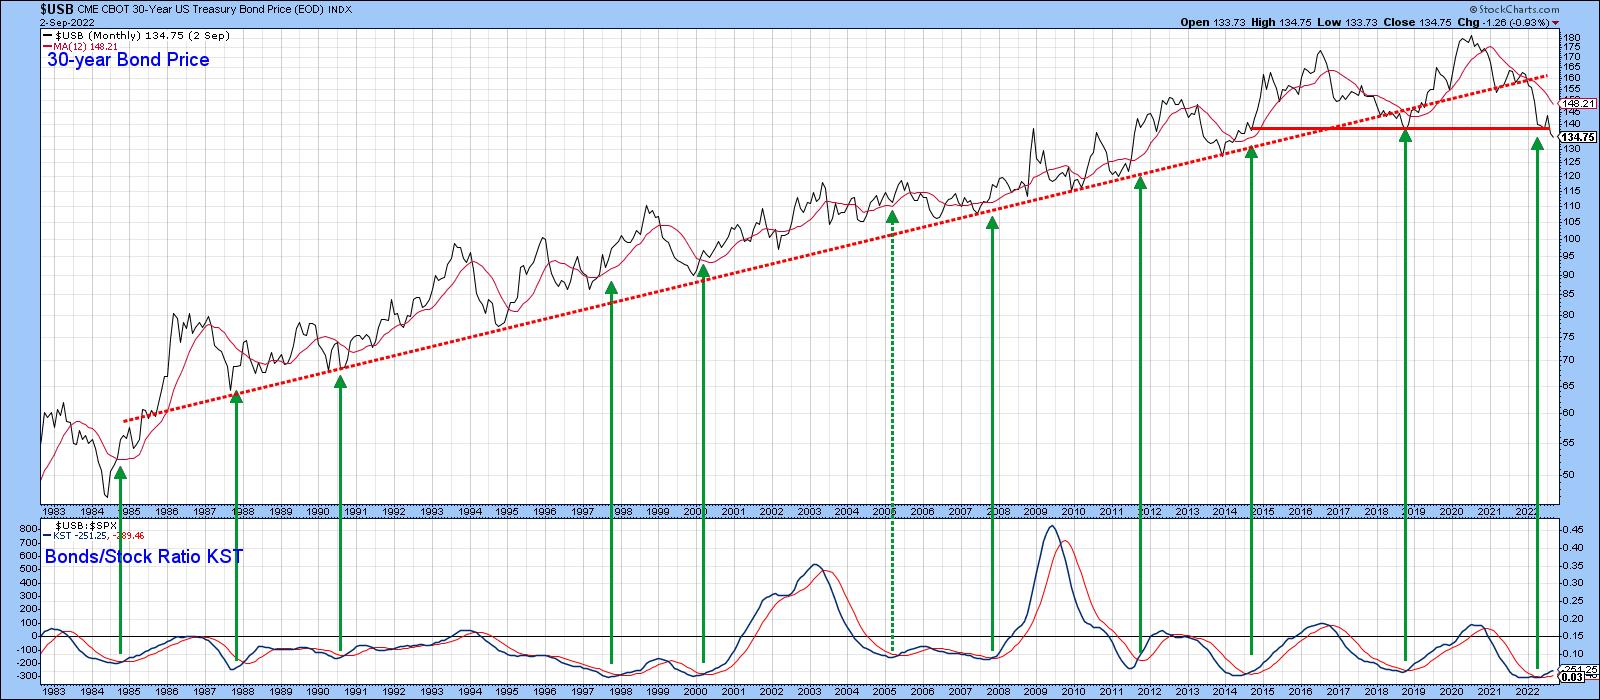 Chart 2 Chart 2
Chart 2 relates a long-term KST, derived from the stock/bond ratio to bond prices themselves. When momentum bottoms, it indicates we have reached a point in the cycle when bonds should be expected to outperform stocks. That usually means the all-clear for bonds to move up in their own right. The KST reversals show there is a consistent relationship between an improving performance for bonds over stocks and a buying opportunity for bonds. Out of the 10 identifiable positive KST reversals, only one (flagged by a dashed arrow) can be said to have been a false positive. An eleventh signal was triggered recently, suggesting that bond prices may soon be headed higher as part of that secular topping-out process.
A more intuitive interasset relationship for bonds themselves comes from the ratio between bonds and their sworn enemy, commodity prices (Chart 3). If you refer back to Figure 1, you can see that, by the time the cycle reaches the pink-shaded area, bond prices have already gone through most of their bear market, whereas commodities are in the early stages of one. That means that bond prices are getting ready to base out since the downward pressure on them from rising commodity prices has dissipated. One way of timing that transitional process is to observe when bonds have begun to outperform commodities. That inflection point seems to develop when the KST of the bond/commodity relationship crosses above its 9-month MA from a sub-zero position, hence the arrows. At present, the KST is in a declining mode, so a bullish signal has not yet been given. However, it has reached an overstretched reading on the downside, which makes an imminent reversal more likely.
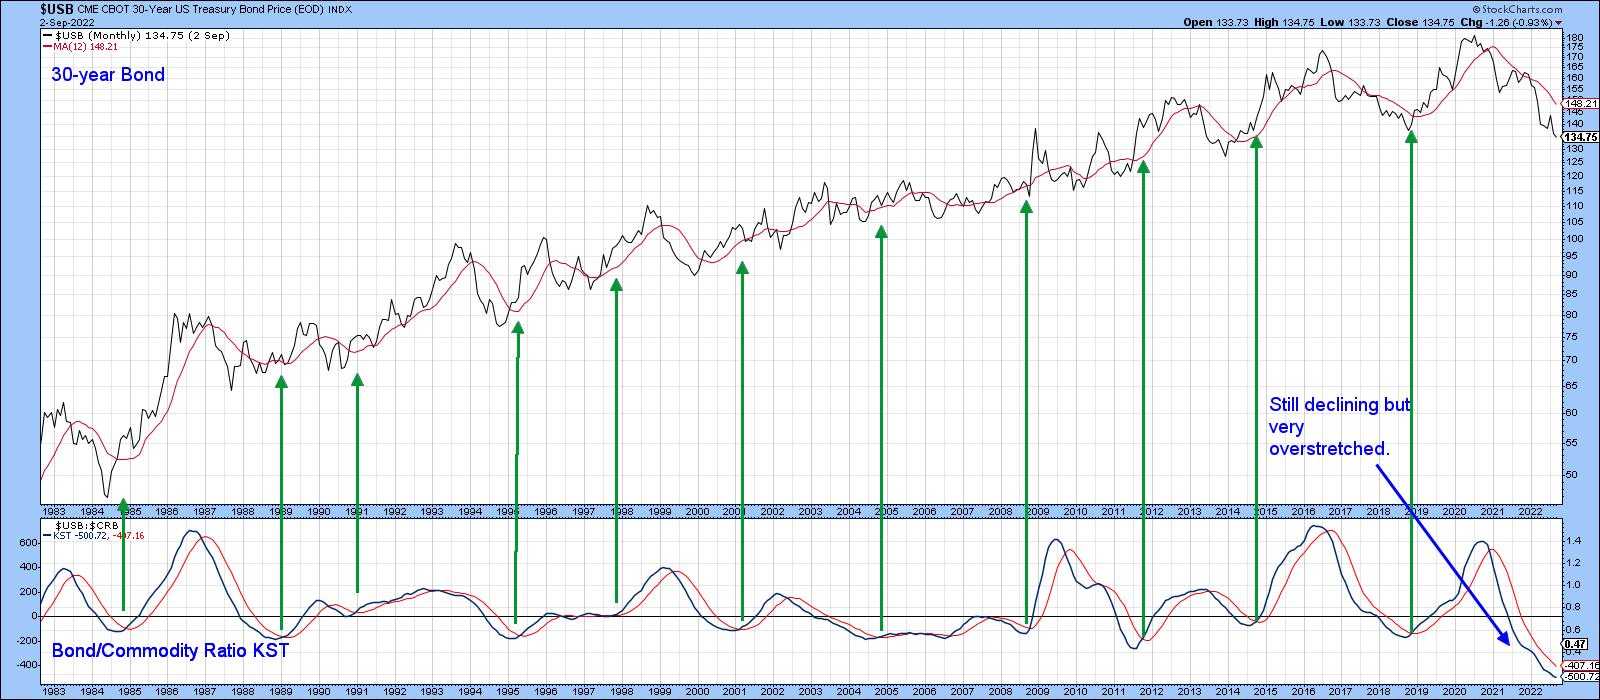 Chart 3 Chart 3
Chart 4 features the ratio itself together with a short-term KST. It looks like the ratio is trying to form a small base. Its completion and the violation of the down trendline would probably be sufficient to reverse the long-term KST in the previous chart. Remember, it's possible to update any of the charts in this article by simply clicking on them.
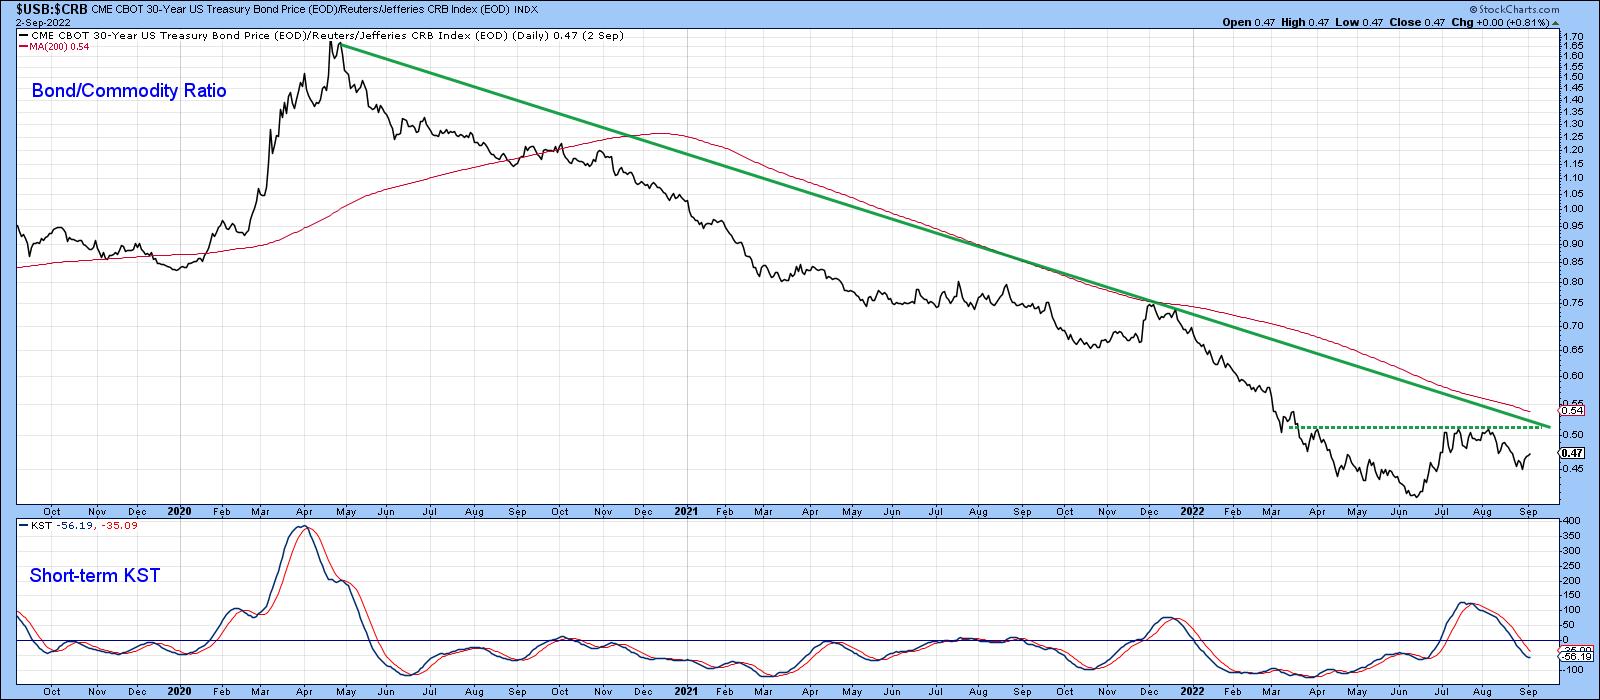 Chart 4 Chart 4
Conclusion
There are some encouraging signs that bonds may be getting ready for a rally. The bad news is that it would likely represent a large retracement move as part of an overall secular topping-out process. Hence the use of the word mini-bull in the title.
Good luck and good charting,
Martin J. Pring
The views expressed in this article are those of the author and do not necessarily reflect the position or opinion of Pring Turner Capital Group of Walnut Creek or its affiliates.
|
| READ ONLINE → |
|
|
|
| Mish's Market Minute |
| One Key Moving Average in Stocks Cleared: Now What? |
| by Mish Schneider |
Reserve Chairman Jerome Powell's speech this past week cautioned against prematurely loosening monetary policy.
Powell's speech reminds us that the Fed is focused on keeping inflation under control. Nonetheless, what we also learned this week is that technical matter. It is far more crucial to monitor price movements and utilize technical indicators for momentum and market direction.
The overall market has been heading higher, and both the S&P 500 (SPY) and Russell 2000 (IWM) have crossed critical areas of support. The 50-day moving average, in fact, cleared in all indices and most key sectors. Now, we focus on the overhead resistance levels at higher price targets.
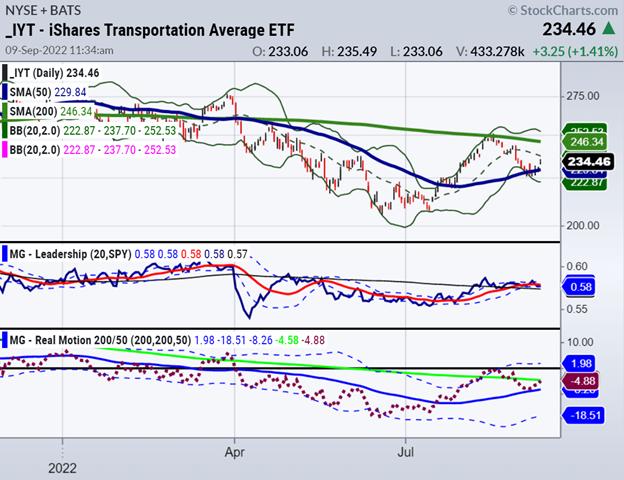
We turn to the charts of a couple of members of the Economic Modern Family to gain clarity. Transports (IYT) and Regional Banks "Prodigal Son" (KRE) are in focus, along with SPY. While not in the family, SPY is, however, a reliable indication of the health of large-cap and small-cap companies.
IYT has crossed the 50-day moving average. We featured this sector in particular both in blogs and in the media last week. Why? Because if goods are in demand and people are moving, then things are not so bad as many would have you believe.
Momentum indicators illustrate resistance, however. Hence, we will watch the 50-DMA to hold, but also anticipate selling to come in at around the 240 level. The 50-DMA is the go-to right now everywhere.
The 200-DMA has stopped the rallies since the big breakdown in April.

Similarly, "Prodigal Son" regional banking (KRE) is also above the 50-day moving average and fighting hard to regain a daily, weekly and monthly longer-term uptrend.
KRE has a lot of work to do to rally over 65.00 and then hold.
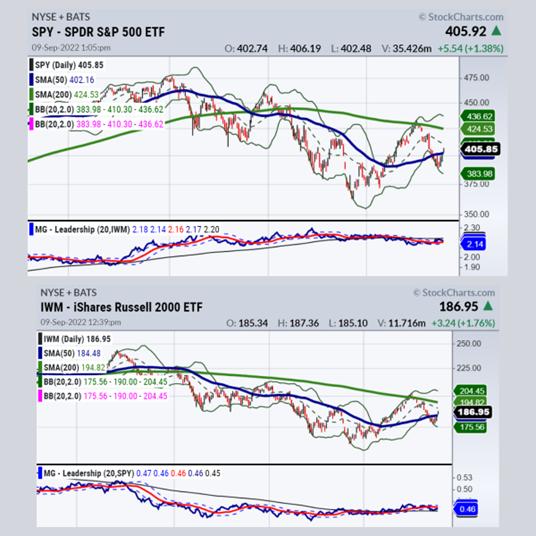
While IYT and KRE crossed their 50-DMAs last Wednesday, SPY and IWM finally caught up on Friday. Now, both must confirm by holding those levels. IWM has better momentum according to our MarketGauge Real Motion indicator. Hopefully, that means something next week.
How long will this rally last? Note the levels on DIA and QQQ listed below. Also, get ready for some key economic numbers, such as CPI. And most importantly, think "active," know your risk, take profits on rallies AND, until further notice, be aware this is still a bear market rally, using phases as our navigation.
This week on media, Mish talked a lot about the macro and the technical -- please be sure to have a listen.
Traders can gain an advantage in the market by using MarketGauge's proprietary technical analysis tools, such as the triple play indicator, comparable market phases, downward momentum, volume analysis and positive trend strength (TSI), used in conjunction with the Modern Family to make better-informed trading decisions.
To learn more about how to identify trend changes using indicators and the Modern Family, reach out via chat, phone, or email, or book a call with Rob Quinn, our Chief Strategy Consultant, by clicking here.
Mish's Upcoming Seminars
ChartCon 2022: October 7-8th, Seattle (FULLY VIRTUAL EVENT). Join me and 16 other elite market experts for live trading rooms, fireside chats, and panel discussions. Learn more here.
The Money Show: Join me and many wonderful speakers at the Money Show in Orlando, beginning October 30th running thru November 1st; spend Halloween with us!
 Get your copy of Plant Your Money Tree: A Guide to Growing Your Wealth and a special bonus here. Get your copy of Plant Your Money Tree: A Guide to Growing Your Wealth and a special bonus here.
Follow Mish on Twitter @marketminute for stock picks and more. Follow Mish on Instagram (mishschneider) for daily morning videos. To see updated media clips, click here.
Mish in the Media
In this appearance on Nasdaq Talks, Jill Malandrino and Mish talk Fed, dollar, moving averages and stock picks.
On the Friday edition of Cheddar TV's Opening Bell, Mish covers the EU, U.S. and what to watch for concerning Fed, econ stats and technicals.
Mish discusses how meme stocks are formed, where to find them and how to trade them on CNBC Asia.
Mish tells you why and what she is looking to buy right now on this appearance with Charles Payne on Fox Business.
Read Mish's latest article for CMC Markets, titled "The Most Important Sector to Watch Right Now".
In this appearance on Neil Cavuto's Coast to Coast on Fox Business, Mish gives a quick rundown on how to assess what will happen next.
ETF Summary
- S&P 500 (SPY): 402 (50-DMA) must hold and if does, next is 410.
- Russell 2000 (IWM): 184-185 (50-DMA) must old and if it does, 190 is next.
- Dow (DIA): Closed at 322 (50-DMA) on the button.
- Nasdaq (QQQ): Closed at 307 (50-DMA) on the button.
- KRE (Regional Banks): 62.70 (50-DMA) held; now 65 must clear.
- SMH (Semiconductors): STILL the weakest -- 215 needs to hold.
- IYT (Transportation): 232 must hold (50-DMA), 240 resistance.
- IBB (Biotechnology): 125 support, 128.50 (200-DMA).
- XRT (Retail): Must hold 65 area now; if fails, could be early warning sign.
Mish Schneider
MarketGauge.com
Director of Trading Research and Education
|
| READ ONLINE → |
|
|
|
| Top Advisors Corner |
| A Rainbow Convergence and a Head-and-Shoulders |
| by Tom McClellan |
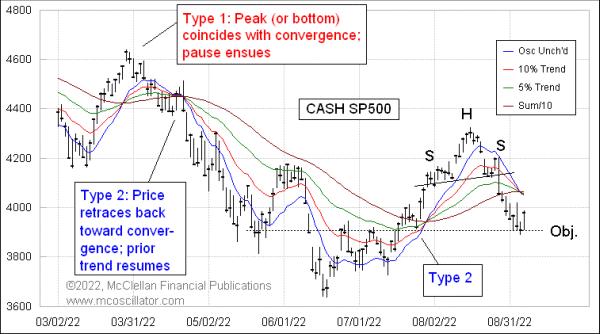
This week's chart is the one I have been watching very closely the past few days and sharing in my Daily Edition. It has multiple things all going on at the same time, and presents a great lesson on a couple of important chart analysis principles.
The first and more elementary point is that the S&P 500 just recently formed a classic head-and-shoulders (H&S) top structure. A H&S is important not because it is a top (or if inverted, a bottom), but because it provides us with a measuring objective for a price move once the neckline breaks. The way this principle works is that you measure the height of the head above the neckline, and apply that distance in the opposite direction from the point where the neckline gets broken, and that measurement gives the objective for the move. Here is a diagram:
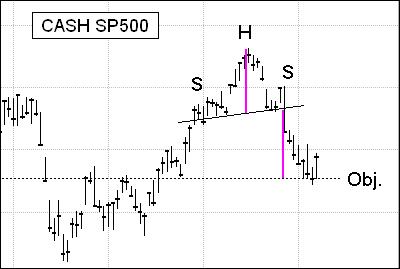
If the neckline is tilted a little bit, as it is in this example, then the measurement gets just a little bit more complicated, but it is not too hard to do. In this case, the downside objective was to around 3900 on the S&P 500 Index. Reaching a H&S objective does not mean that the move has to stop; it is a target, not a floor. Its purpose is to know where to take profits on a move, if prices get there, which is also not guaranteed. There are failures to reach the objective.
In the case of the down move into September 2022, the S&P 500 met that objective pretty precisely and has now bounced. It is a fairly impressive example of this principle. And it just so happens, coincidentally, that the 3900 level, which is the H&S objective, has acted as an important support and resistance level more than once in the recent past, making it a great place to expect support to work again.
While all of this was happening, there was also the formation of what we call a "rainbow convergence" of the four moving average type lines in the top chart. Only two of these lines are actual moving averages, the 10% Trend and the 5% Trend. These are exponential moving averages, and the difference between them is the McClellan Price Oscillator. See this link for how to calculate the 10% Trend and 5% Trend.
The other two lines are more complicated, but, in my view, they are worth the trouble to calculate and include on the chart. The Price Oscillator Unchanged level represents the theoretical price where the Price Oscillator would be exactly unchanged from the day before. It acts like a fast moving average, but is not one.
The Sum/10 line is a Summation Index of Price Oscillator values, which is then divided by 10 to put it back down into the range of where prices are. It, too, acts like a moving average, a slower one, but it is not one. See this link for more on these calculations:
A convergence of these four lines is important, but its meaning varies according to how prices are behaving at the moment of the convergence. In a Type 1 rainbow convergence event, an accelerated price move serves to pull together the four moving average type lines, and the moment of the convergence marks the entry into a pause period. That pause can be just a rest break, or it can be a reversal. Which one it is depends on what prices do, and the mission of the pause is to conduct a test of the Price Oscillator Unchanged line. How that test goes determines what comes next. Seeing prices moving across the Price Oscillator Unchanged line signals a trend change or reversal. Testing and failing to penetrate it is a sign that the trend prior to the pause should resume itself.
In a Type 2 rainbow convergence, the price will retrace back toward the price-time point of the impending rainbow convergence, but not retrace beyond it. The message of a Type 2 convergence is that the trend preceding the retracement should resume itself.
It is pretty clear by now that the September 6, 2022 low was a textbook example of a Type 1 rainbow convergence. Prices bottomed on the exact day that the four moving average type lines converged. The message of a Type 1 is that prices should pause, meaning that the downtrend is on hold for a while. The mission of the pause is to make a test of the blue Price Oscillator Unchanged line, which, at the moment, is still several points above the current price level. So we should expect to see a few days' worth of a pause in the downtrend while that test process gets worked out.
The fun part of this moment in time is that we are seeing the simultaneous completion of a rainbow convergence just as prices have pretty much exactly reached the measuring objective of the head-and-shoulders structure. Things do not always work out so neatly, but it is fun to see these rare examples when two wholly independent charting disciplines come to work together.
|
| READ ONLINE → |
|
|
|
| MORE ARTICLES → |
|