Crypto has been Kryponite for investors since November 2021. The holders (HODL - Hold On for Dear Life) have been hammered. Recently, crypto has started to behave better including going sideways, while the stock market pulled back in late August.
(In the charts below, the daily version has a yellow background, while the weekly has a graphite background.)
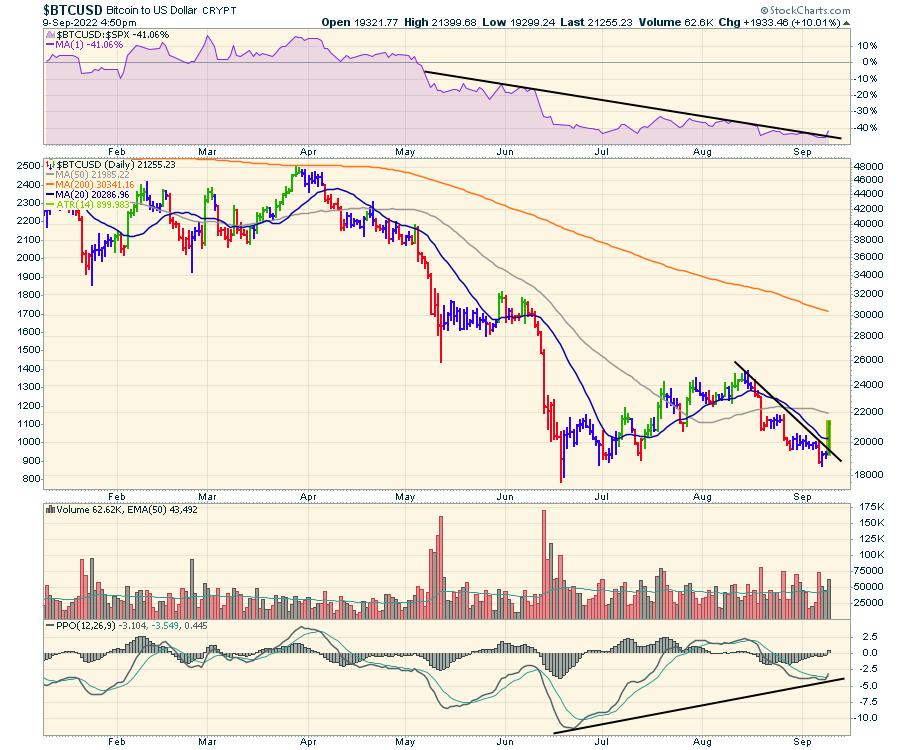
Bitcoin ($BTCUSD) is the most common chart. On Friday, the chart fired off like a rocket heading higher, breaking the smooth downtrend it was building.
A few bullish things I see on the chart:
- The relative strength to the $SPX (RS) is breaking the downtrend.
- On a wider scale, this is also a double bottom location with the June/July lows.
- The PPO is making a significantly higher low than the June low.
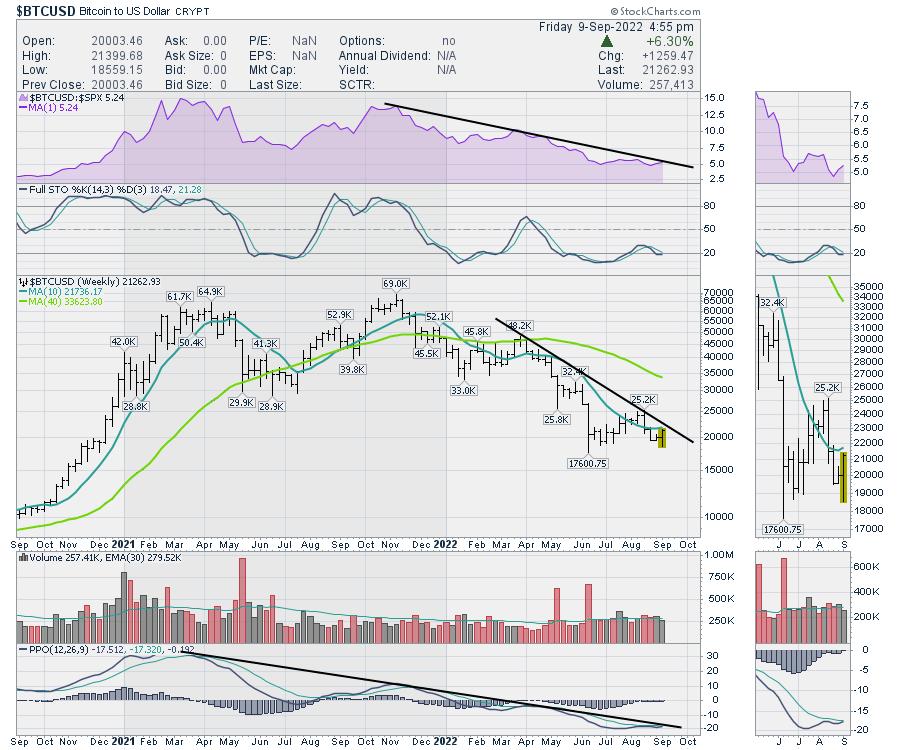
Going to the weekly chart, Bitcoin has a few things I like to see as well, but they haven't flipped a signal yet.
- The Purple RS is close to breaking the downtrend.
- The full stochastic looks like a higher low and is trying to move above the 20% line and the signal line.
- The PPO shows the momentum hitting a high in February 2021. Can it break out of the PPO downtrend?
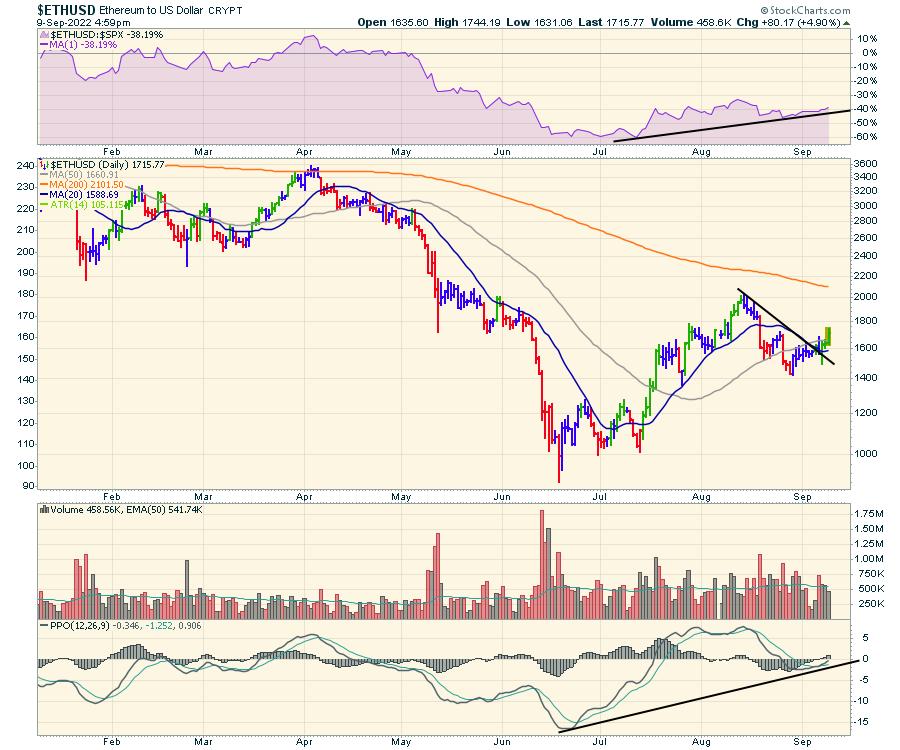
Ethereum has a few of the same clues forming:
- The RS has been trending higher since July.
- Price broke the downtrend a week ago.
- Price is making a much higher low whereas Bitcoin was making a double bottom.
- Price has a series of higher lows.
- The PPO has a much higher low than the June low and is almost in positive territory.
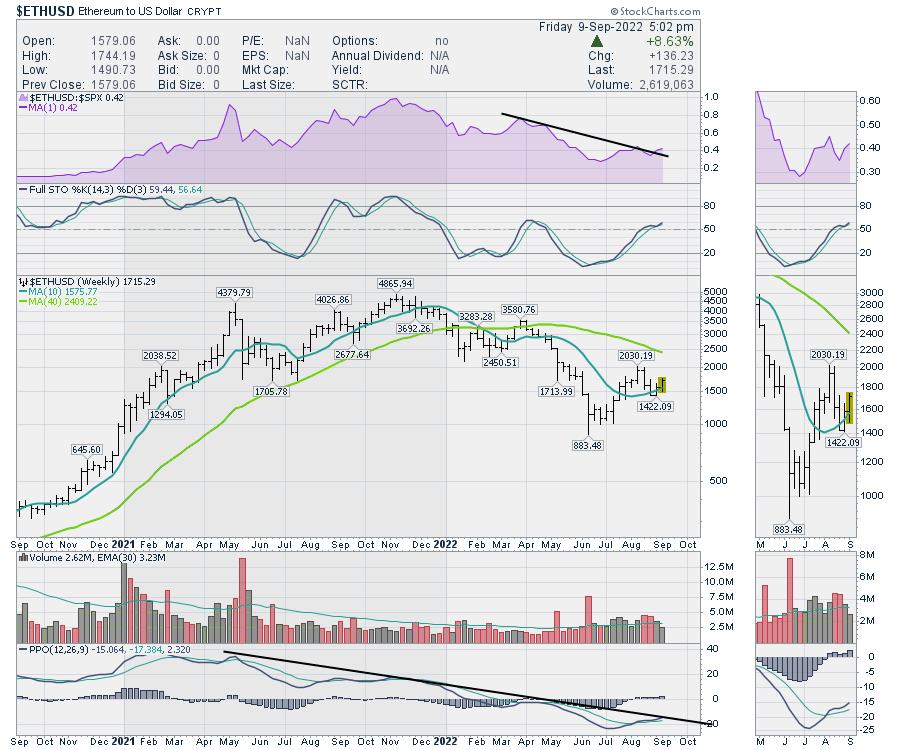
The Ethereum Weekly chart is also improving:
- The RS line is breaking out!
- The full stochastic is restarting a move above 50%, which is very bullish on a weekly chart.
- Price is making a 3-week high.
- The 10-week moving average is looking like support here.
- The PPO downtrend is close to breaking.
- The PPO is already on a buy signal!
If we are looking for a turning point, these charts look to be ready. It's been a tough drop off the highs, but the opportunity might be here for the next wave higher.
I'll be hosting a presentation on September 20th at 1 PM ET. The purpose of the presentation is to explain more about the Osprey Strategies approach to the market. Follow this link to register at Osprey Strategies.
Special Presentation
Join me, I think we'll have a lot of fun, and I am sure you'll pick up a few clues to how we perform!
Good trading,
Greg Schnell, CMT, MFTA
Senior Technical Analyst, StockCharts.com
Author, Stock Charts For Dummies
Want to stay on top of the market's latest intermarket signals?
– Follow @SchnellInvestor on Twitter
– Connect with Greg on LinkedIn
– Subscribe to The Canadian Technician
– Email at info@gregschnell.com


