Art's Charts October 30, 2015 at 12:42 PM
Commentary Highlights: Bulk of the Evidence Is..... Read More
Art's Charts October 29, 2015 at 09:35 AM
Commentary Highlights: QQQ and SPY Near Highs // End of Month Seasonality // Regional Banks Power Finance Sector // 50% Participation is Enough to Power SPX // Software and Internet Lead Techs // GDX Fails to Break Out // Palladium Corrects after Impulse Surge // Oil Gets Oversol... Read More
Art's Charts October 27, 2015 at 10:02 AM
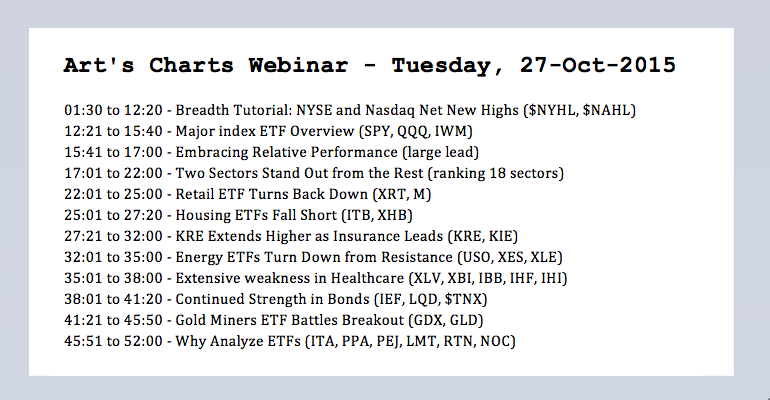
Embracing Relative Performance There is really only one thing to do with relative performance metrics: embrace them. If large-caps are outperforming small-caps, then favor large-caps over small-caps... Read More
Art's Charts October 26, 2015 at 09:31 AM
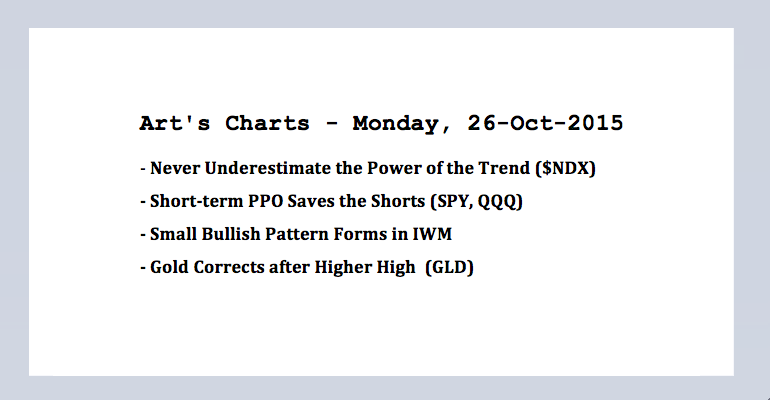
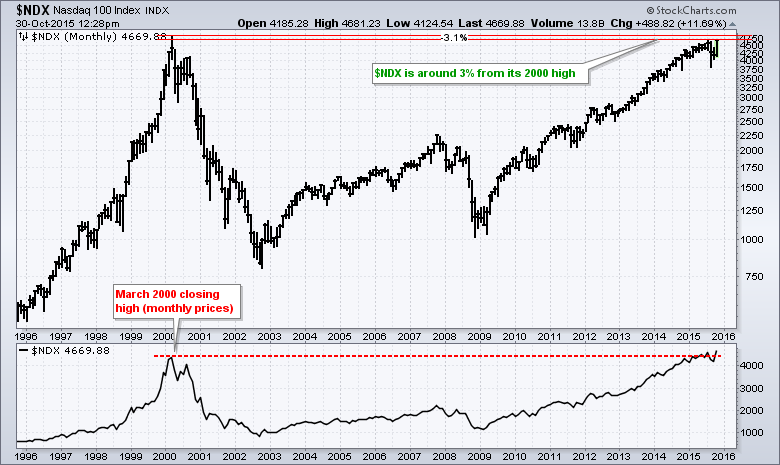
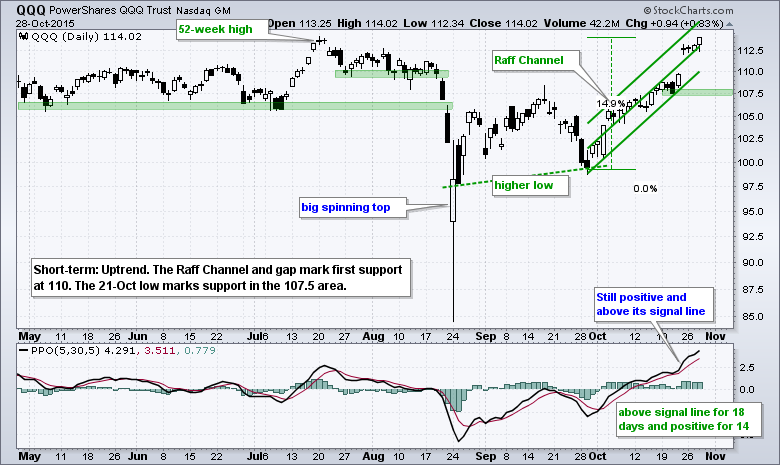
Never Underestimate the Power of the Trend An important change occurred over the last two weeks as the overall market environment moved from bearish to bullish... Read More
Art's Charts October 23, 2015 at 10:24 AM
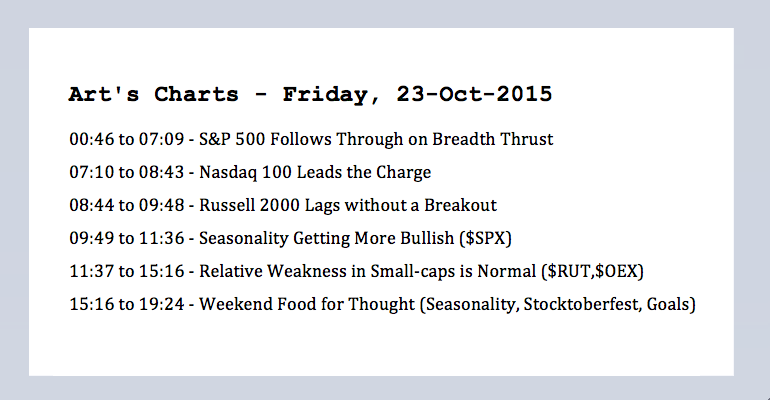
Even though indicators help us quantify price action and add an objective aspect to our analysis, we must still study the price chart and analyze the price action... Read More
Art's Charts October 22, 2015 at 08:35 AM
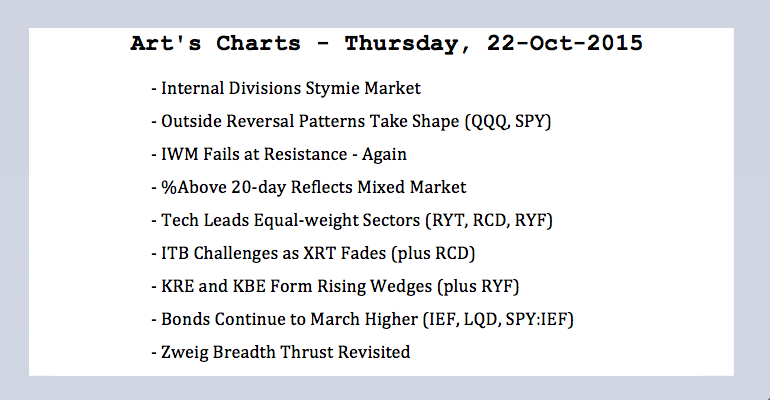
Internal Divisions Stymie Market It is still a tale of two markets. Within the broader stock market, large-caps and large-techs are holding up well, but small-caps and mid-caps are dragging their feet... Read More
Art's Charts October 20, 2015 at 09:52 AM
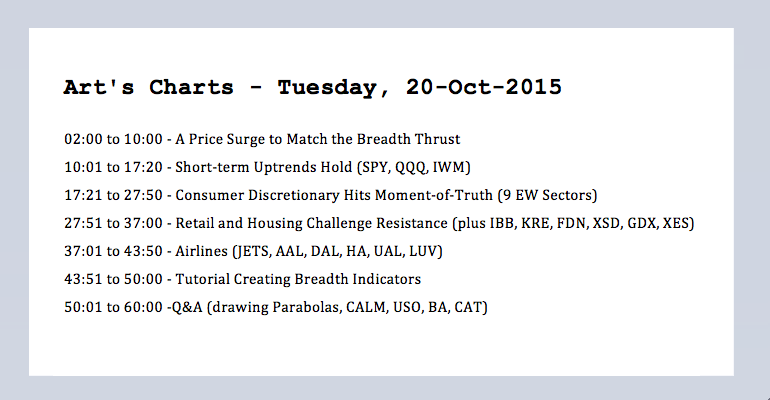
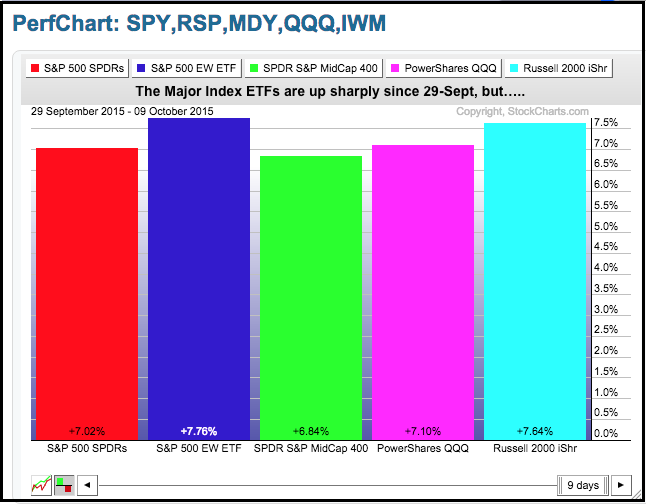
A Price Surge to Match the Breadth Thrust It has been one heck of a three week period. SPY is up around 8%, QQQ is up around 9% and the Russell 2000 iShares (IWM) is up around 7.5%. There are, of course, two ways to interpret these price surges... Read More
Art's Charts October 19, 2015 at 09:28 AM
I am starting to entertain the idea that the surge from late September to mid October was strong enough to negate the August breakdowns in SPY and QQQ. The bounce over the last few weeks contained strong breadth and strong upside volume... Read More
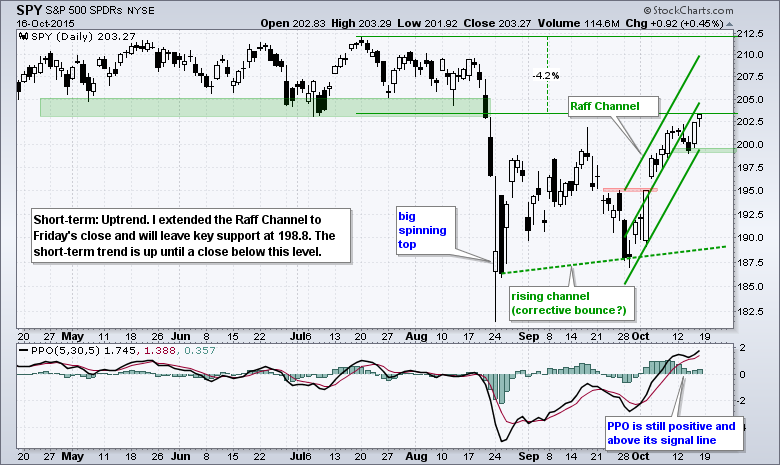
Art's Charts October 16, 2015 at 11:35 AM
Today I will start with weekly charts for the S&P 500, Nasdaq 100 and Russell 2000, or the big three as I call these major stock indices. One remains in an uptrend, one is close to reversing its downtrend and one remains in a clear downtrend... Read More
Art's Charts October 15, 2015 at 08:12 AM
Stalling and not Really Falling (Yet) Looking at the big three major index ETFs, two of the three are still short-term bullish and have yet to break down. QQQ stalled with some serious indecision the last four days... Read More
Art's Charts October 14, 2015 at 06:00 AM
Small-caps Show Relative Weakness After stalling for two days, the major index ETFs moved lower on Tuesday with the Russell 2000 iShares (IWM) leading the way. Small-caps were lagging in September and they continue to lag in October... Read More
Art's Charts October 13, 2015 at 09:20 AM
Stymied Indexes Form Narrow Range Days Stocks stalled on Monday with mixed action in the major index ETFs. Stalling or sideways price action reflects a stand-off between bulls and bears (buying pressure and selling pressure)... Read More
Art's Charts October 12, 2015 at 09:21 AM
The major index ETFs are nearing their moment-of-truth as the smaller uptrends start to challenge the bigger downtrends. I am still assuming that the August breakdowns signaled the start of a bigger downtrend... Read More
Art's Charts October 09, 2015 at 12:27 PM
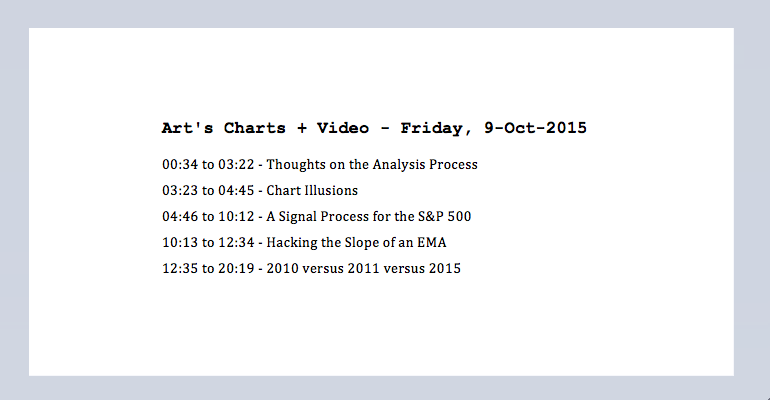
Before looking at some charts to establish the bigger trend, I would like to philosophize a little on the analysis process and my approach. I use basic chart analysis and some simple trend-following indicators to define the trend and trade accordingly... Read More
Art's Charts October 08, 2015 at 08:13 AM
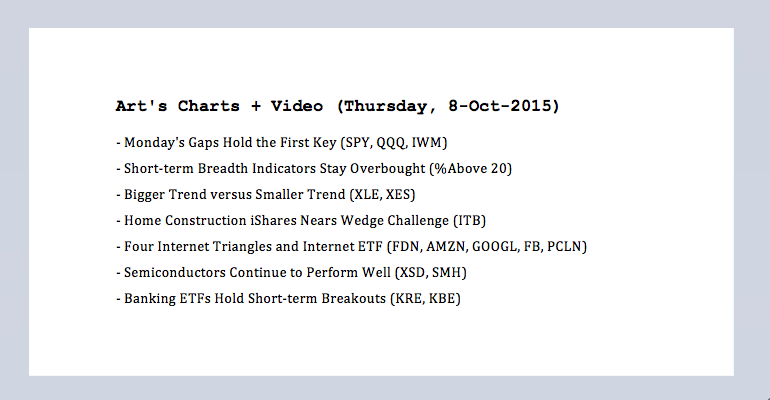
Monday's Gaps Hold the First Key I am still working under the assumption that bigger trend is down after the August break down. Furthermore, SPY and QQQ are in the midst of counter trend moves denoted by a rising channel... Read More
Art's Charts October 07, 2015 at 07:28 AM
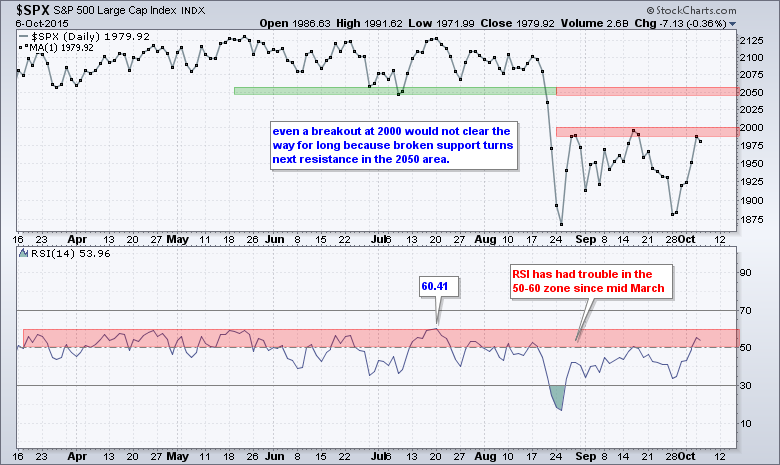
Overall, the major index ETFs remain in no man's land. Put another way, the market is between a rock (bigger downtrend) and a hard place (smaller uptrend). The bigger trend turned down with the August breakdown and broken resistance represents the rock around 2050... Read More
Art's Charts October 06, 2015 at 09:31 AM
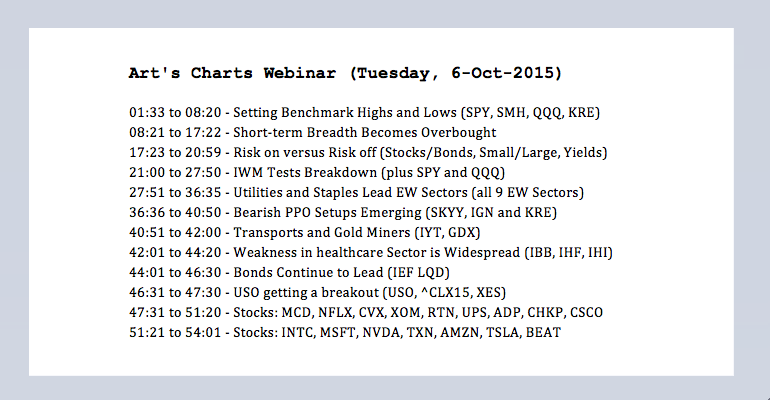
Welcome to No Man's Land After months of dull trading, the stock market turned into Thrillsville in late August and volatility has continued into early October. This volatility is reminiscent of the periods from June to August 2010 and from early August to early October 2011... Read More
Art's Charts October 05, 2015 at 09:06 AM
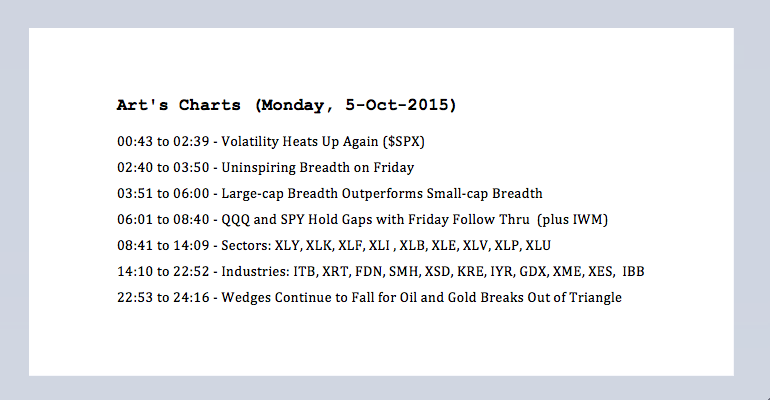
Note that I will post a video around 10AM ET. Volatility is clearly heating up as the S&P 500 completed its fifth 3+ percent swing since the August closing low. That is almost one 3+ percent swing per week (based on closing prices). With a 3... Read More
Art's Charts October 02, 2015 at 09:41 AM
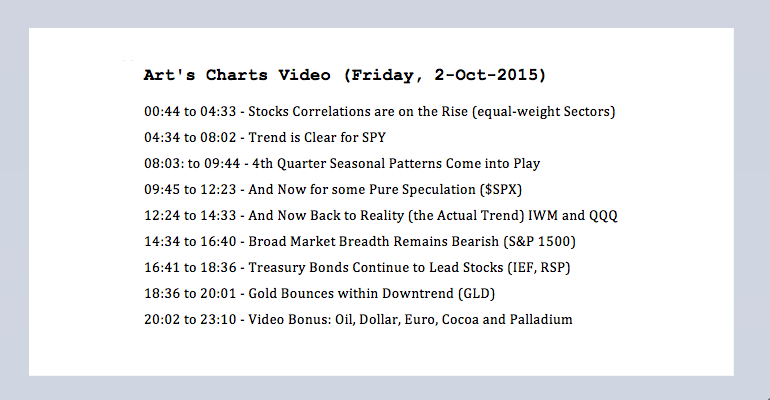
Note that I will add a video around 11AM ET. Stock futures were higher before the employment report and then moved sharply lower after non-farm payrolls came in below expectations. Bonds are moving higher and the 10-YR Treasury Yield ($TNX) fell below 2%... Read More
Art's Charts October 01, 2015 at 08:56 AM
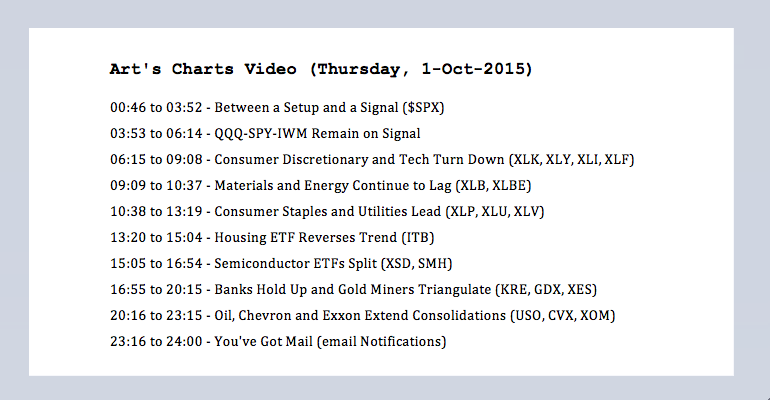
Between a Setup and a Signal Note that I will post a video around 10AM ET. Trends are the driving force, signals are the exception and no-man's land is the norm. What the heck does that mean? First, the bigger trend is the driving force in my trading strategy... Read More