Well, the webinar survey for the Commodities Countdown Webinar 20151008 smashed all of the comment feedback I usually get from my webinars. With all of the data lining up for a critical measurement point in the markets over the next few weeks, the webinar focused on why the $SPX 2060 level will be more pivotal than any other spot on the $SPX in the last three years.
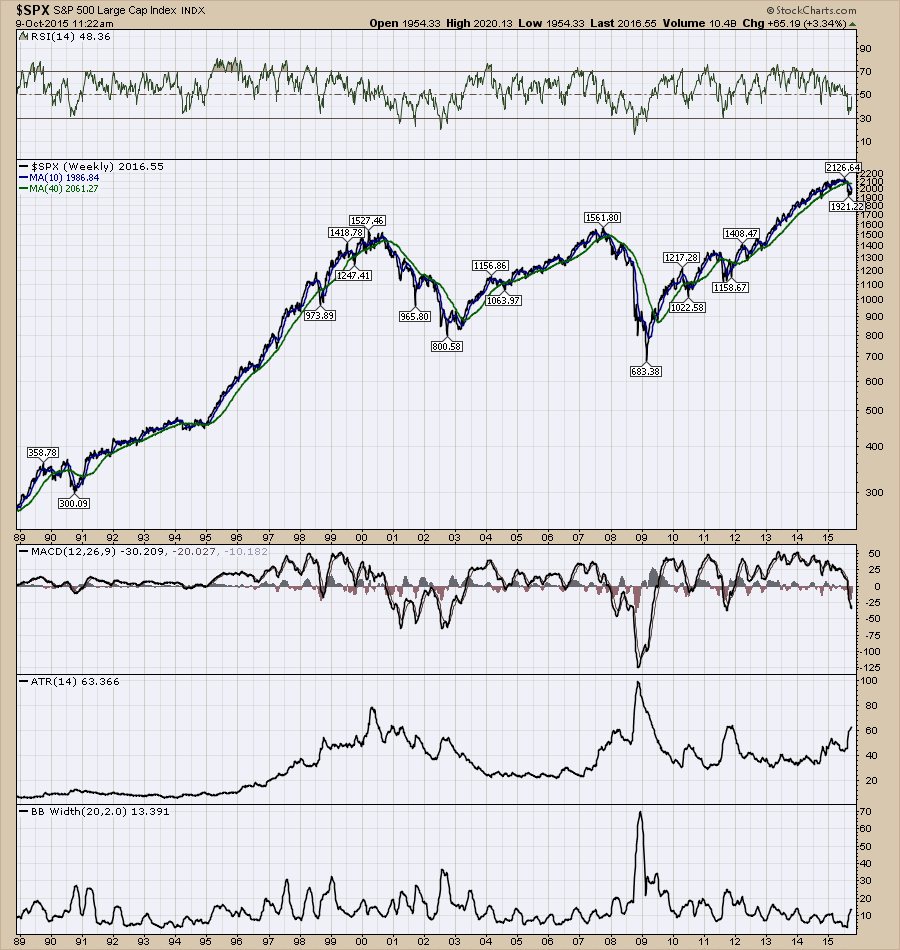
I started with a historical review of the $SPX. I discussed major points on the chart shown below. I simply used the MACD on the chart below and studied the areas where the indicator went below zero. The chart below is clickable, and you can find more information on the webinar over the first 20 minutes. Commodities Countdown 20151008.
The next area in the presentation covered off some indicators that only fire off signals for major bull / bear markets. Some of these charts were updated versions from a blog post on The Canadian Technician Blog of March 31, 2015.
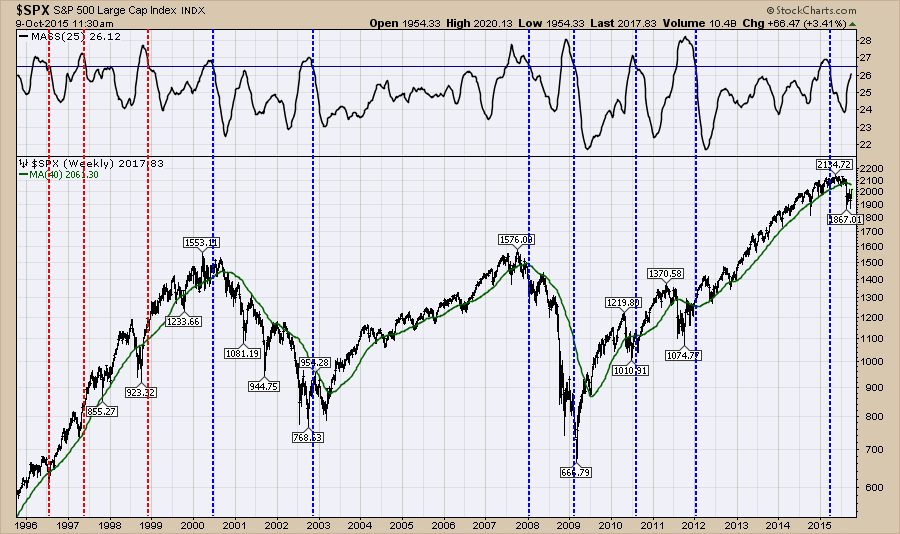
Here is one example, but there were 4 in total. This utilizes the "Mass Index" to find major tops or bottoms and a reversal signal occurs when the index has surged to 27 and rolled over. Crossing below 26 is confirmation of the signal and time to act.
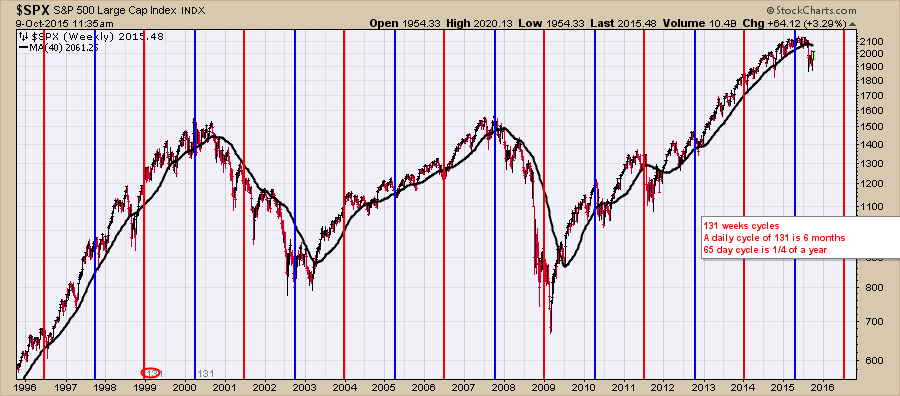
One of the other charts is a cycle chart with the 131-week cycle on it. I had discovered the cycle years ago by trial and error or best-fit analysis. At the IFTA conference in Tokyo, Japan, I gained some more appreciation for why this market cycle might be more connected than I thought. You can click on the chart to see a live version. My commentary on the webinar will add a lot more context to the chart. Commodities Countdown 20151008.
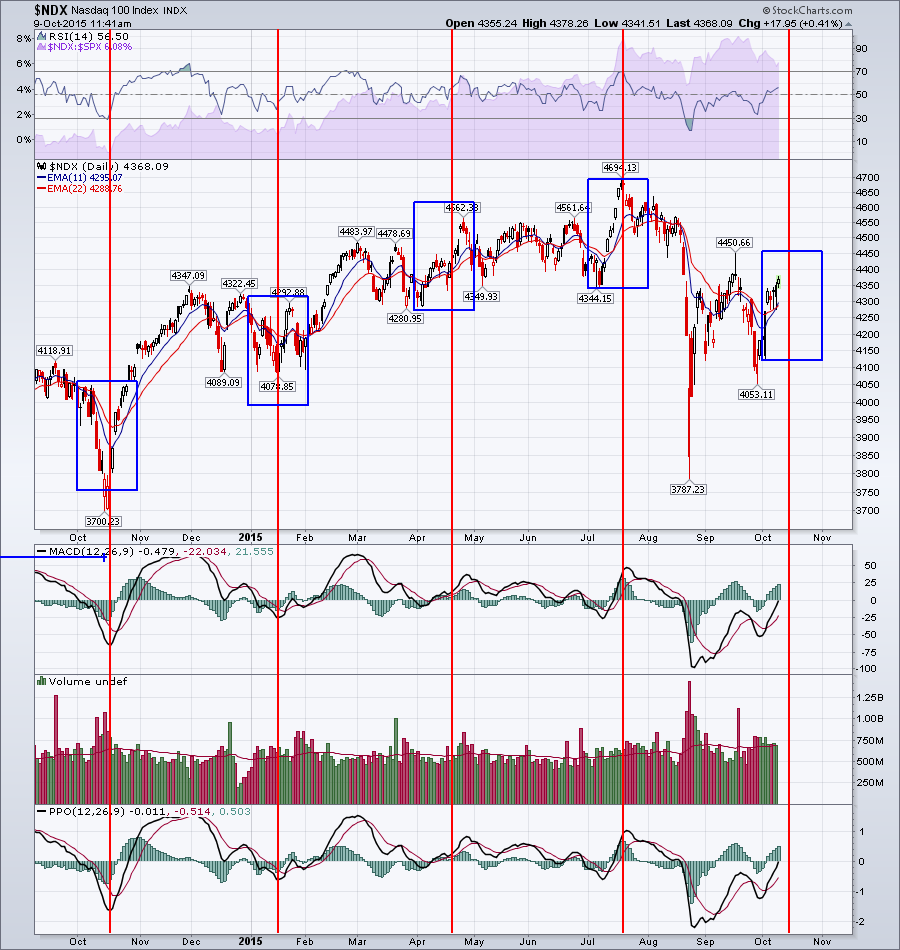
The next chart generated massive feedback in the webinar survey. I'll try to post a separate blog about the chart and its makeup. The webinar goes into how this chart started, how the box size was created and what the red lines are indicative of. The chart history goes back to 2010 and this chart had Bill stopping the presentation as everyone wanted to know more right then! Commodities Countdown 20151008.
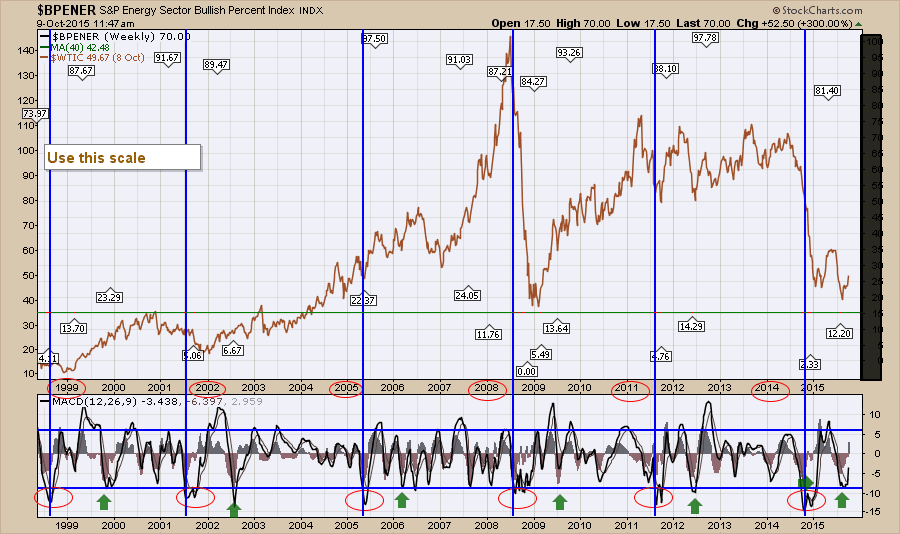
The Bullish Percent Index chart for Energy that we have been following gave us an enormous boost this week. This has been on our radar for weeks and we were not disappointed with the kick that we got from the sector. While my chart format is unique, the power of the move was really significant. Because of the major discussions on the indexes and the charts shown above, the commodities were lightly covered. Next week will be a deeper dive into the energy and resource stocks.
That was a selection from the webinar. This webinar marked the start of our second year for doing them and I think we've come a long way in the development, the delivery, and the dissemination of information to our audience. I hope you'll take the time to connect with the most recent webinar as I think it will stand the test of time preparing people for the major moves into the fourth quarter. Commodities Countdown 20151008. The webinar from the week before addressed the potential for a global bear market settling in and the charts were compelling. If you missed it, that link is here. Commodities Countdown 20151001.
I would encourage you to sign up for email notifications at the bottom of this blog if you are interested in following the developments of the markets from my "Commodities Centric" point of view. As there are lots of changes going on at StockCharts for the presentations of the webinars and blogs, the easiest way to track the articles you would like to catch is by subscribing. Just click the green Yes button below!
Lastly, next week I will be doing the Canadian Technician webinar on Tuesday and the Commodities Countdown Webinar on Thursday. Both of those webinars will be dominated by the price action in the commodities markets and the timing should be heating up. The links will be posted this weekend on the Home Page.
Good trading,
Greg Schnell, CMT
@schnellinvestor
