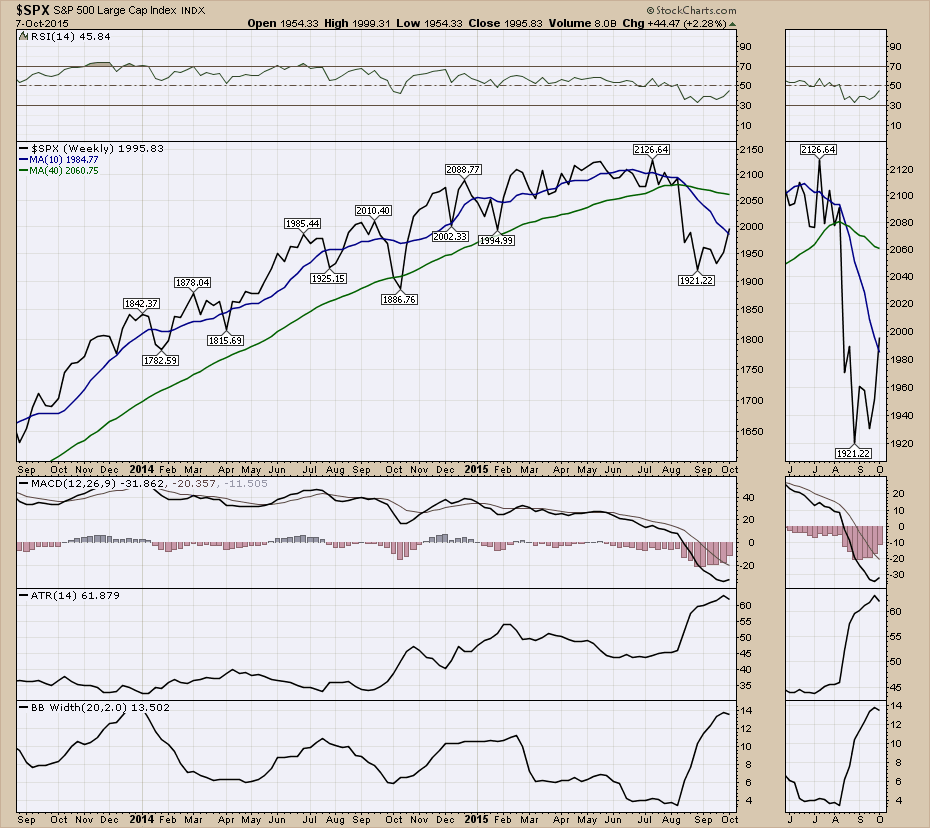
I covered off the commodities last week on the webinar and focused in on the $USD. The link to that webinar recording is here. Commodities Countdown 20151001. There is a lot of information in that webinar about the signals making for a bear market in my work. As it would be boring to cover off the same angles every week, I will put together some other charts regarding what we would need to see to confirm the bear top. This week I have compiled 10 unique charts as reference maps.
I will also be focused in on the crude oil area in the webinar on Thursday, October 8, 2015. I will cover off the Bullish Percent chart that we have been working from in the webinars. I have some great stock examples that are interesting in the oil and gas sector. We have bear market signals in the overall market, so this is a critical week to study the macro trend. I have so much to cover for the webinar, I hope you can join me. The link to the webinar is always on the What's New section of the StockCharts home page or the What's New section of the members page. This link is for the Commodities Countdown 20151008 Webinar registration.
Lastly, you can subscribe to get notified whenever there is a new blog article on this page. Click on the Yes button below. As I am still building the content up, please join me if you enjoyed this article.
Good trading,
Greg Schnell, CMT
@schnellinvestor on Twitter

