The ability to add numerous overlays and annotations has added a new dimension to my charting. It wasn't possible to annotate charts from the DecisionPoint.com website without first putting them in another software program and then using the annotation tools there. After annotating, I'd have to save the chart for future viewing. That's fine, but it was static, so each day I would have to do the process all over again.
With SharpCharts, I can set up my charts, annotate them, add overlays and save them. Each day they update and the annotations are still there, moving right along with the new data. Now I can upload them to my blog, share my analysis and allow you to click on them. You the have the power to keep my annotations/overlays or change/add your own and save them.
Using overlays and annotations is very intuitive on the SharpCharts workbench. Once you know where to go, the rest is easy. First, let's examine overlays.
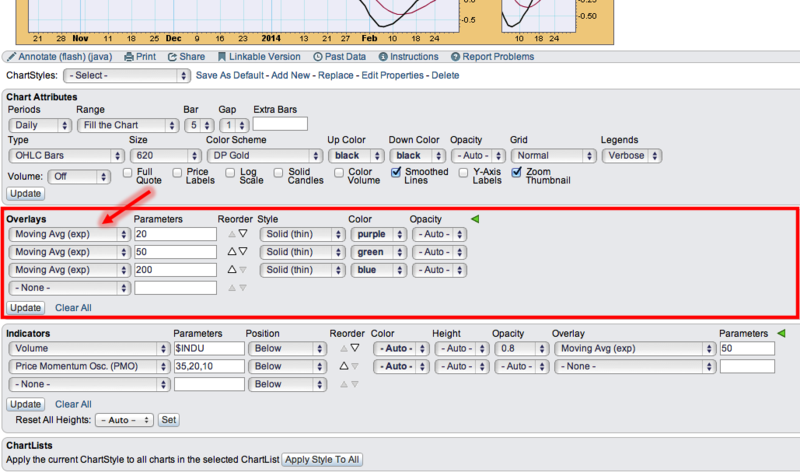
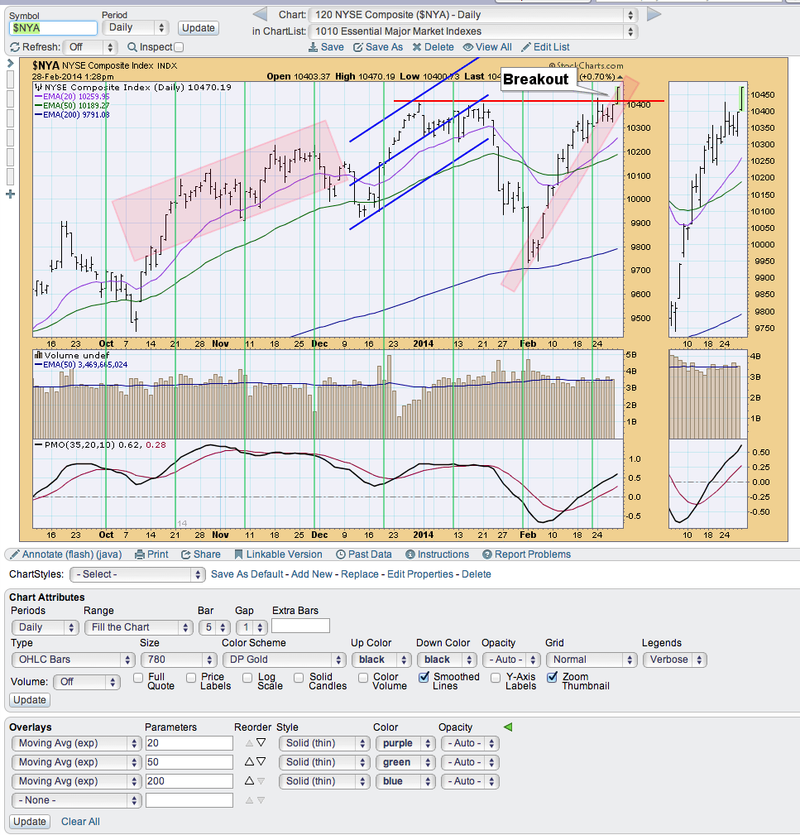
You can find the overlays in the mid-section of the workbench. You can see that I've added three EMAs to overlay price.
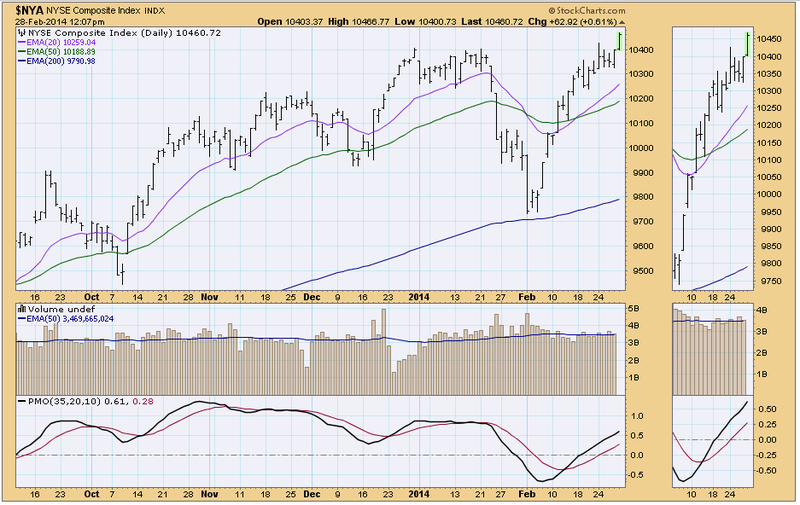
The chart is below (click on it for a live version).
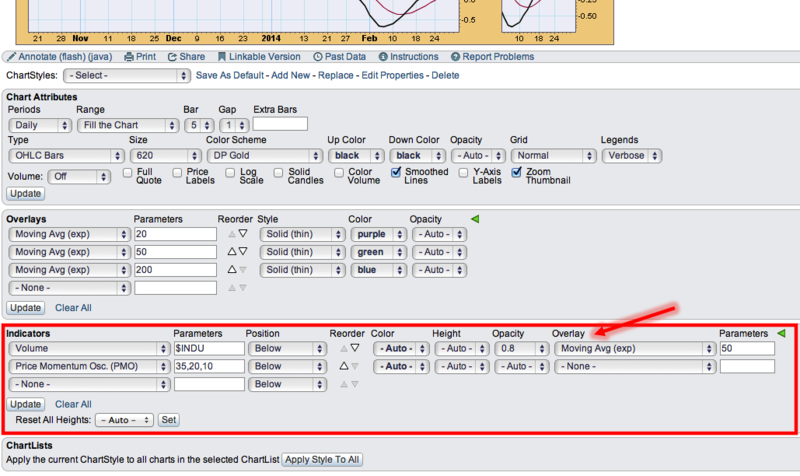
You can also see that I've added an overlay to one of my indicator windows in the chart above. This is a spiffy function that is available in the indicator section to the right of the indicator. In addition, in the indicator window, you can place your indicators above, below or BEHIND price (overlaid).
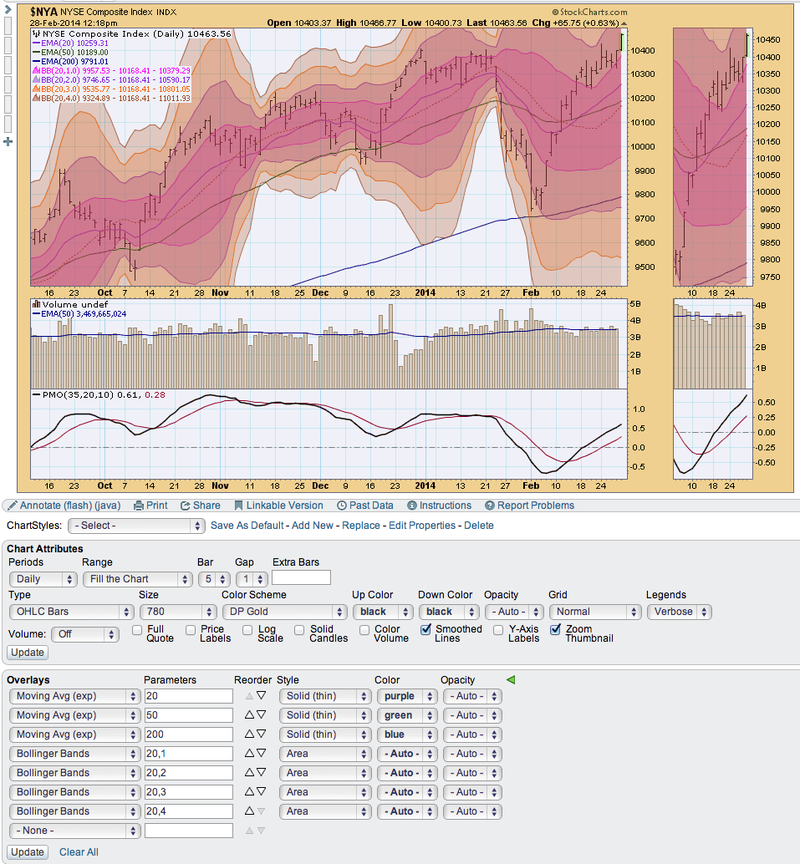
These are fairly simple examples of overlays, the overlay menu has a variety of choices and I suggest you try a few. Let's look at the Bollinger Band. Here is a twist on it. You can choose it to be an "area" and then add a few more, changing the parameters incrementally to create a 'ribbon' effect.
Let's look at annotating a chart. This I find invaluable to my analysis as you probably saw in my last analysis article.
Click on the annotations link under your chart. There are two versions, flash and java. You'll find that one may work better than other depending on your browser.
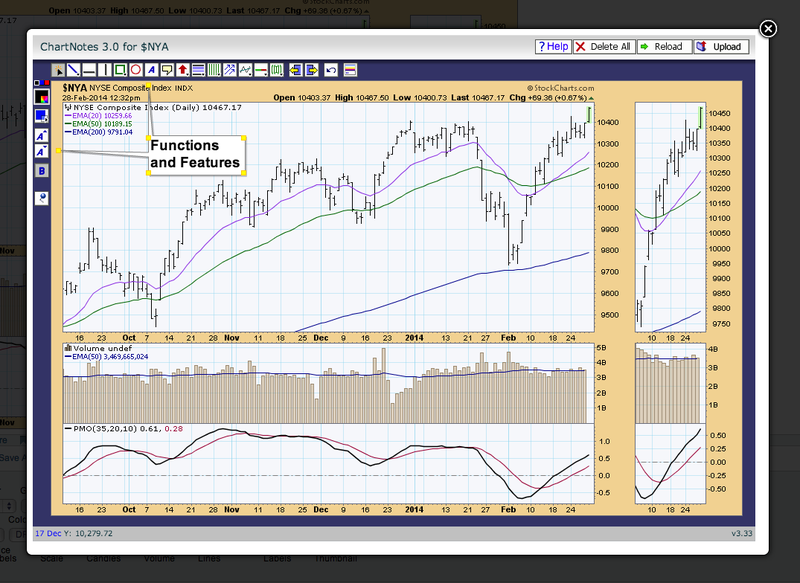
This will bring up the annotations workbench. You'll notice there is vast selection of tools to choose from. I could write a blog on each one, so let me just show you some of the ones I use regularly.
In the chart above, I actually used one of the annotations, the "callout" tool, to point out where the functions and features were. The line/arrow tool is useful. Note that on the left side of the chart, you can change the color, the thickness, add an arrow, make it dotted, etc.
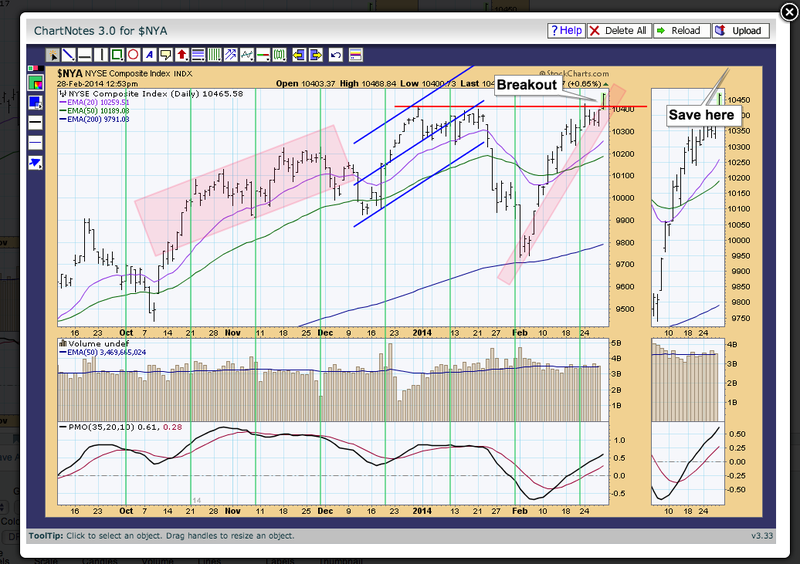
I can already see in the chart above using the line tool that we are seeing a significant breakout above overhead resistance today (Feb 28).
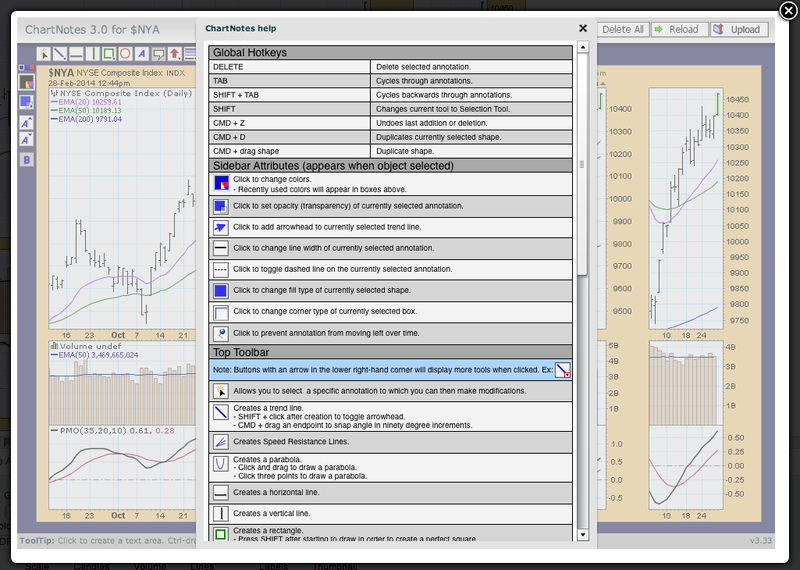
An important button on the annotation tool...the Help button. It explains how to use every one of the tools. It shows up in workbench where you need it and is easily closed when you are done with it.
So now you've created this amazing chart with lots of annotations, it's time to save it for future use. Click the "Upload" button in the upper right hand corner and the chart, with its annotations, is now back in the SharpCharts workbench.
Annotations and overlays allow your charts to tell a story. For me, it allows me to help you to see what I see when I write my blogs. Start writing your chart analysis "stories" and share them with others. That's what enriches the StockCharts community and makes it such a great resource!
Happy Charting!
Erin

