I received numerous emails and concerns throughout this DP to StockCharts transition period from DecisionPoint subscribers regarding the possible loss of the DP Daily Blog. I'm happy to report that it has been moved to the StockCharts.com blog section under "DP Reports". It has a new name now, "DP Daily Update". For those of you unfamiliar with the DP Daily Update, it contains a complete and concise overview of the day's market action in one place. There is a review of the essential DP Gallery indicators and a review of the dollar, gold, bonds and oil. The commentary will help you to understand how to use our indicators and what they are saying that day.
How do you find the DP Daily Update? There are two main ways to reach the Reports blog:
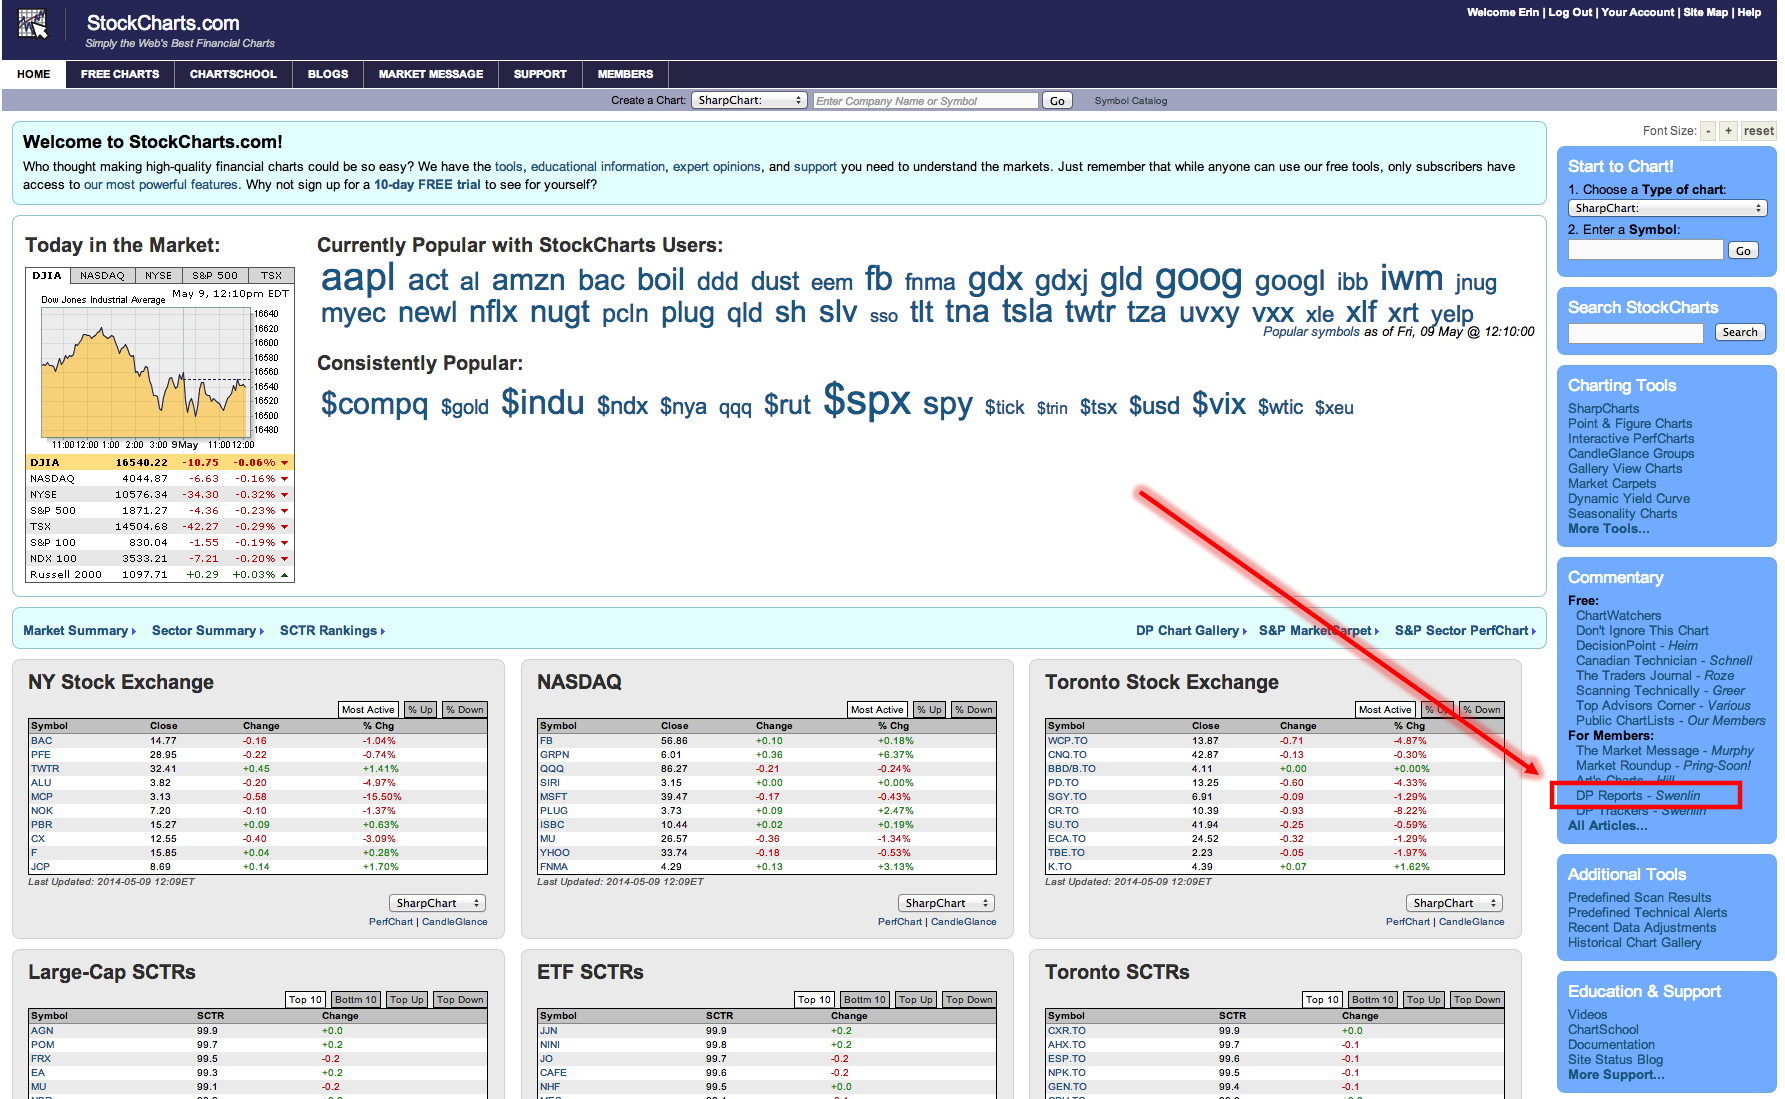
1) From the homepage, click on the DP Reports blog link on the right-hand side of the page:
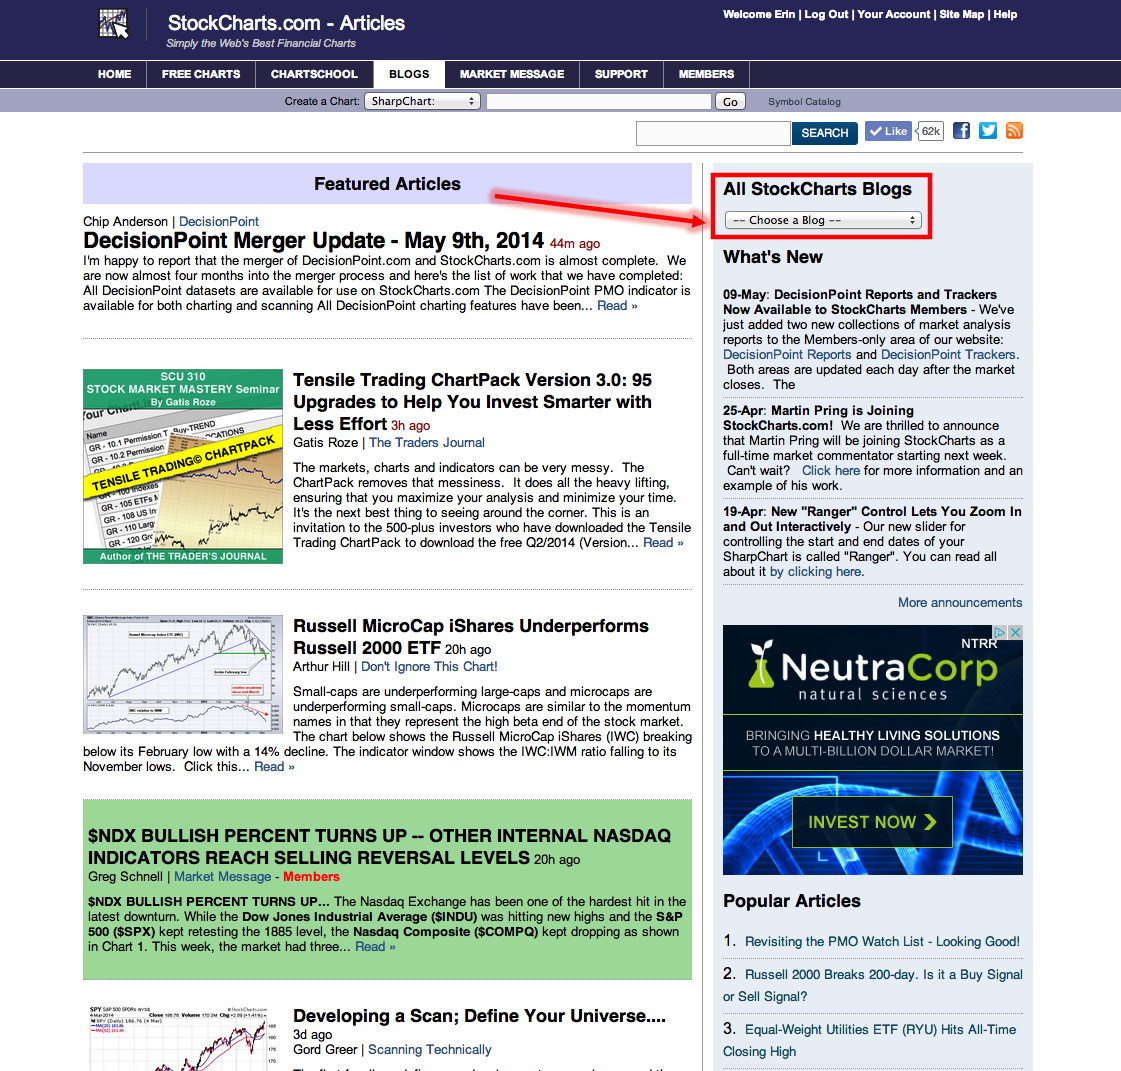
2) From the Blogs homepage (click on the tab at the top of the homepage to reach this page), click on the blog drop-down menu:
Not only will you find the DP Daily Update in the DP Reports blog, you will also find the summary reports that were created everyday for DecsionPoint.com subscribers. Now you can access these reports after the close of the market, AND you can find archived reports from previous days (something that was not possible on DecisionPoint.com). I'll be blogging this week on how to use these reports as well as the Trackers that are in the DP Trackers blog, so stay tuned.
For now let me leave you with a sample of the DP Daily Update. Below is Friday's update. Remember you must be a paid member of StockCharts.com to reach the DP Daily Update.
Happy Charting,
Erin
DP Daily Update: Still A Waiting Game - May 9, 2014
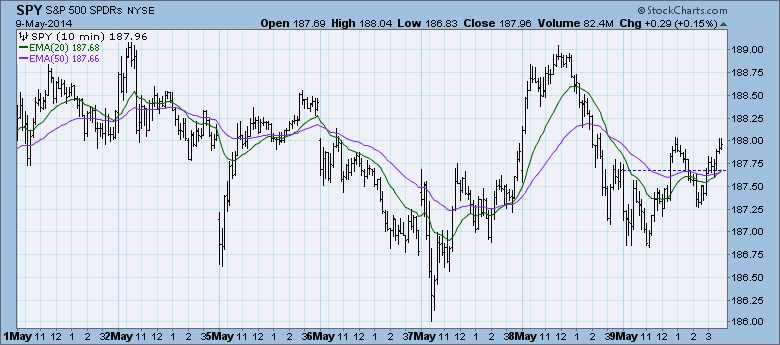
There was not much news and not much action.
SIGNALS: Here we include a picture of the current day's signal table to provide a kind of archive that can be referenced in the future. (To access the current table with active links see the DecisionPoint Alert Daily Report.)
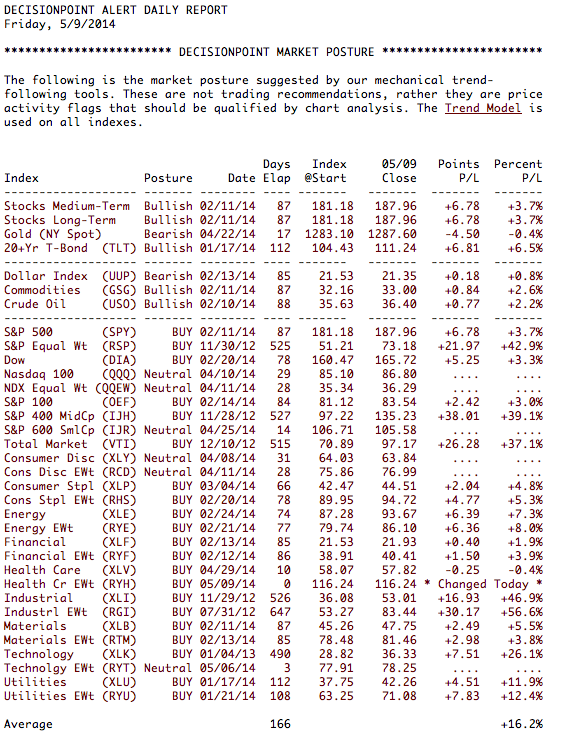
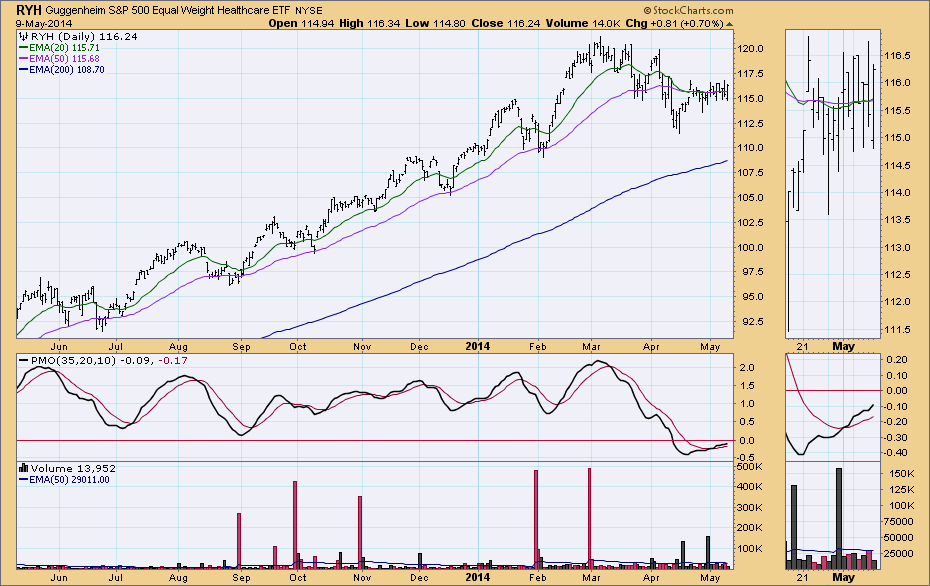
Another whipsaw on RYH. It changed from BUY to NEUTRAL yesterday. Today it switched back to a BUY. This situation is not common, but it is possible.
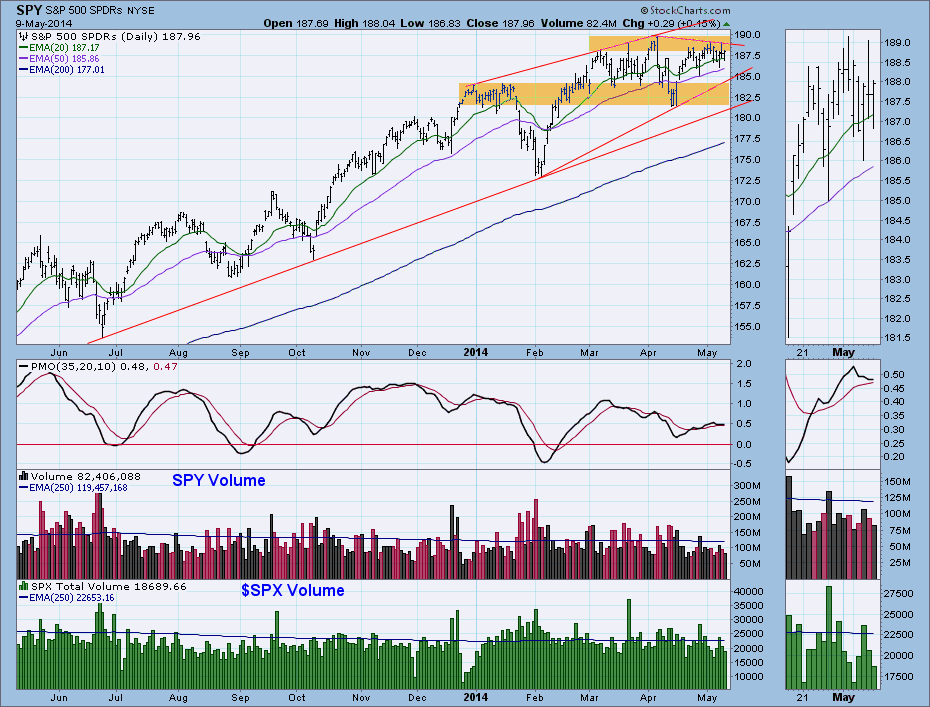
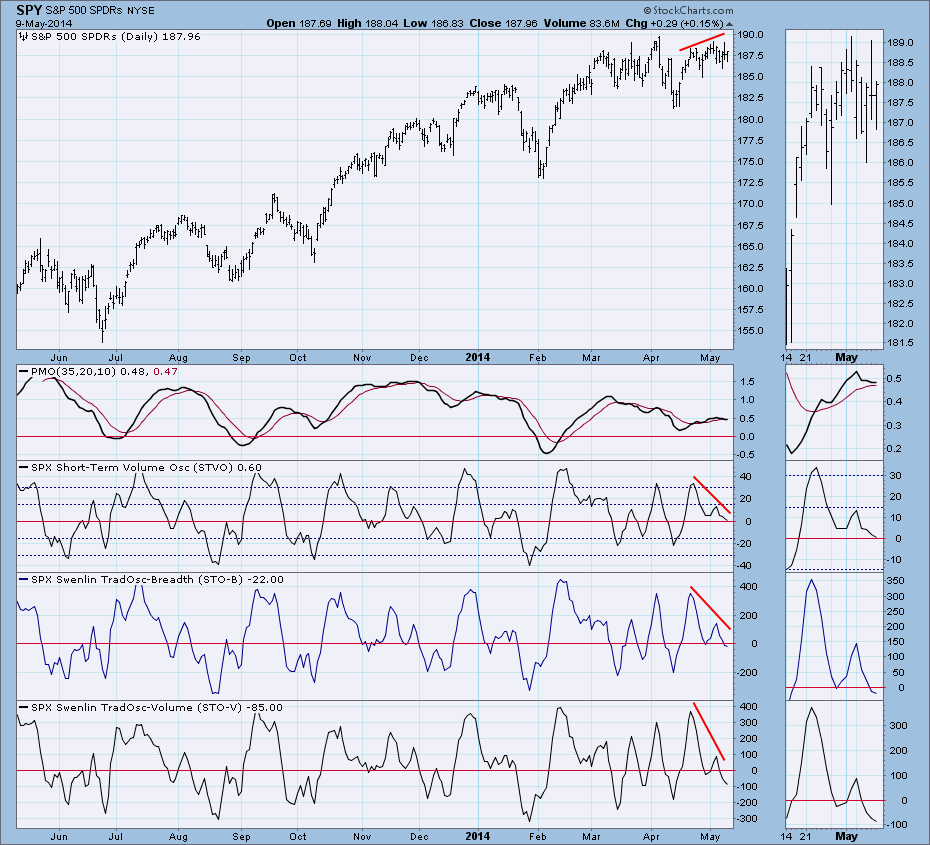
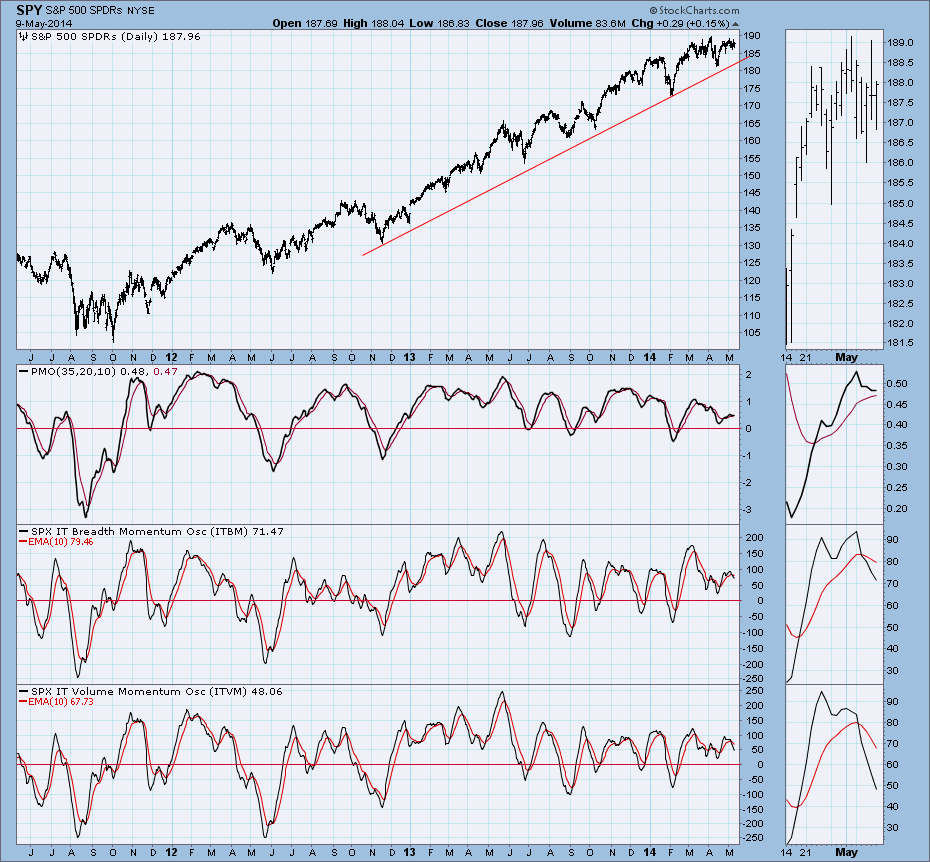
STOCKS: Based upon a 2/11/2014 Trend Model BUY signal, our current intermediate-term market posture for the S&P 500 (SPY) is bullish. The Trend Model, which informs our long-term outlook, is on a BUY signal as of 2/11/2014 so our long-term posture is bullish.
Volume remains below average and resistance still holds.
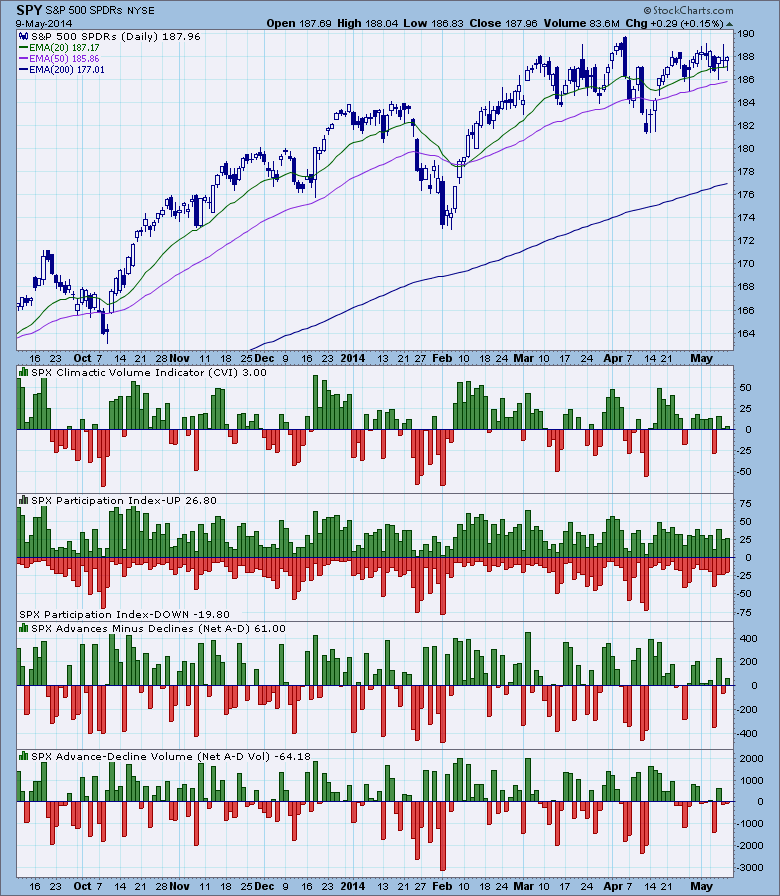
Ultra-Short-Term Indicators: We look for climactic activity here, and there is none today.
Short-Term Indicators: Negative divergences still dominate this time frame.
Intermediate-Term Indicators: They are configured negatively.
Conclusion: Boy, this is getting tedious. The market remains in a trading range. Indicators are somewhat negative, but there is no way to be sure which way this consolidation will resolve. As I keep saying, my gut says this is a topping phase.
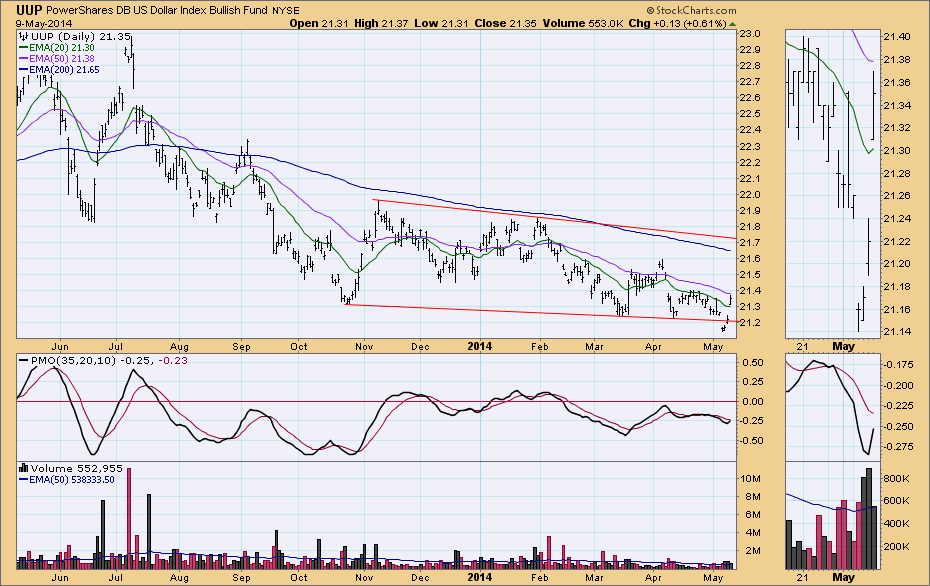
DOLLAR: As of 2/13/2014 the US Dollar Index ETF (UUP) is on a Trend Model SELL signal. The LT Trend Model, which informs our long-term outlook, is on a SELL signal as of 8/13/2013, so our long-term posture is bearish.
The break below support earlier this week proved to be a fakeout.
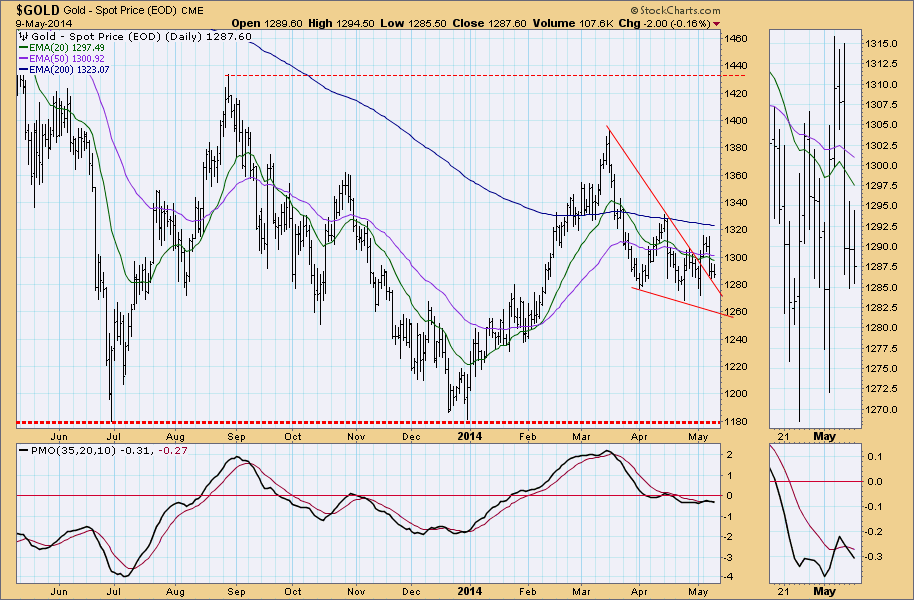
GOLD: As of 4/22/2014 Gold is on a Trend Model SELL signal. The LT Trend Model, which informs our long-term outlook, is on a SELL signal as of 2/15/2013, so our long-term posture is bearish.
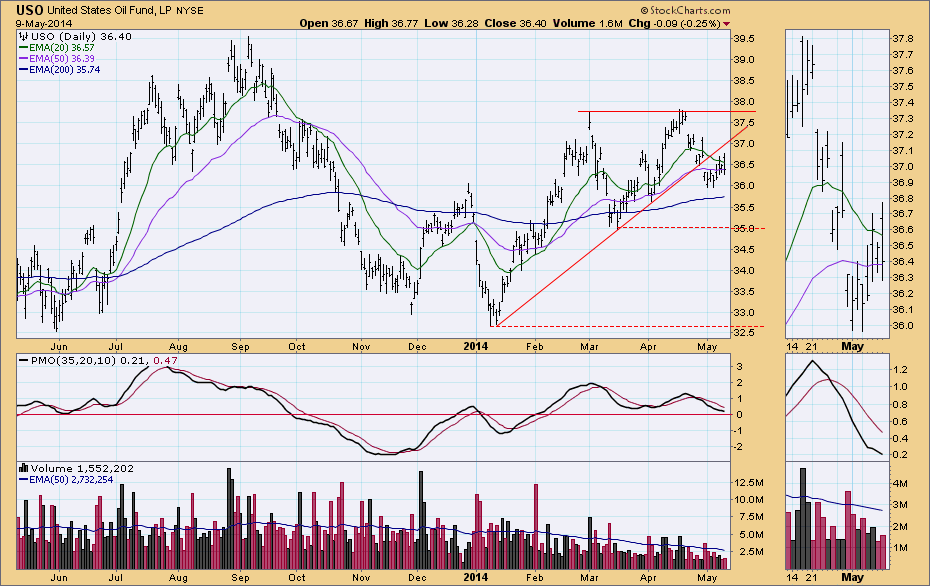
CRUDE OIL (USO): As of 2/10/2014 United States Oil Fund (USO) is on a Trend Model BUY signal. The LT Trend Model, which informs our long-term outlook, is on a BUY signal as of 2/26/2014, so our long-term posture is bullish.
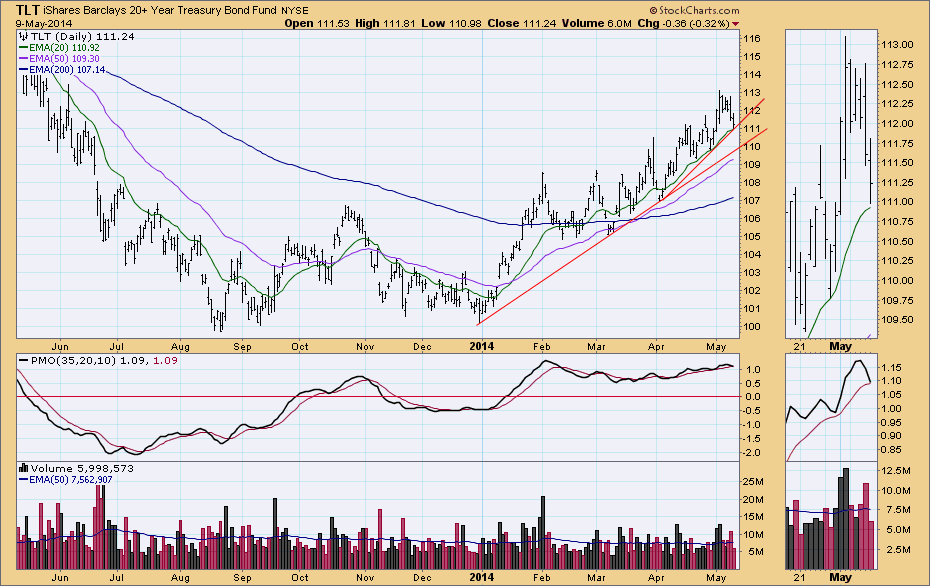
BONDS (TLT): As of 1/17/2014 The 20+ Year T-Bonds ETF (TLT) is on a Trend Model BUY signal. The LT Trend Model, which informs our long-term outlook, is on a BUY signal as of 3/24/2014, so our long-term posture is bullish.
Technical Analysis is a windsock, not a crystal ball.
- Carl

