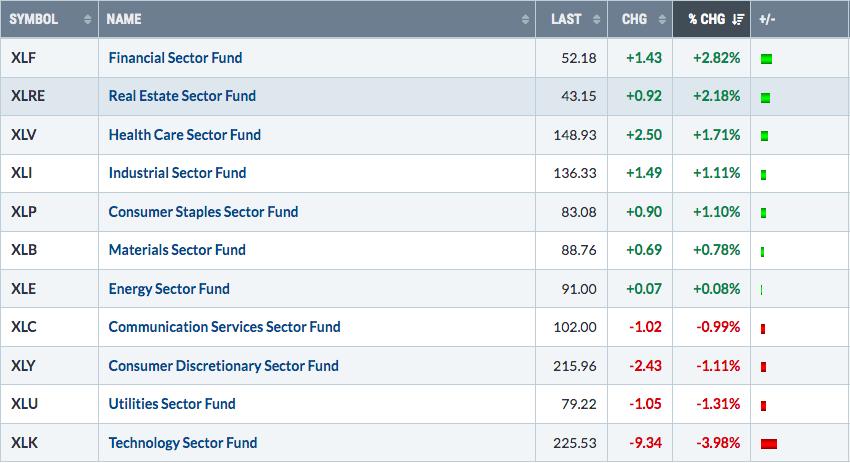
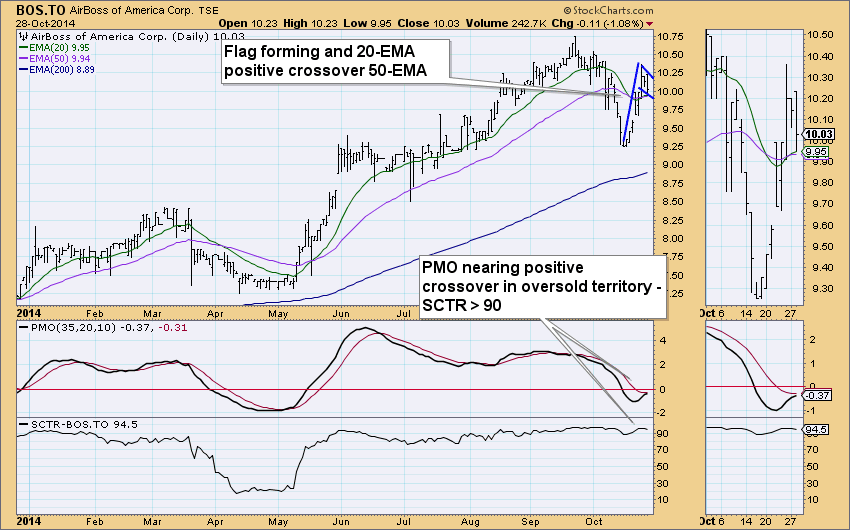
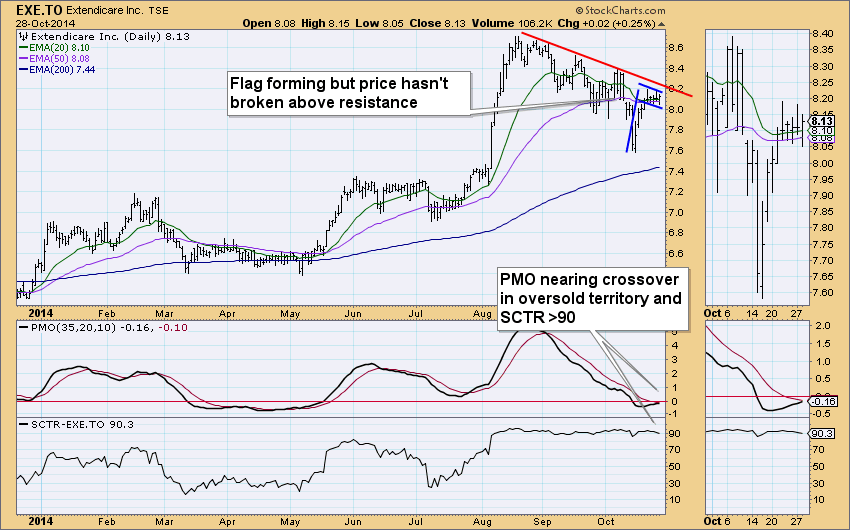
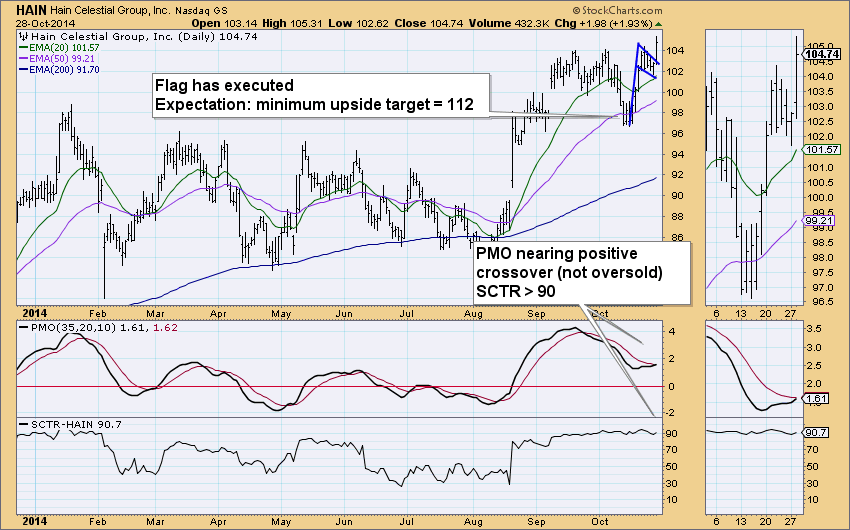
 Today I ran my regular scan to find stocks or ETFs that are rising on fresh momentum. (The scan is listed at the bottom of this blog article.) The results were very interesting as nearly half of the charts showed bullish flag formations. These formations are short-term continuation patterns that can result in significant price moves once executed. It isn't surprising there were plenty of flag formations out there given the recent market action; that is, a sharp rally higher and then a three day pause or consolidation of the move. Once a flag formation executes, the minimum price target is the length of the flagpole from the top of the pennant or flag.
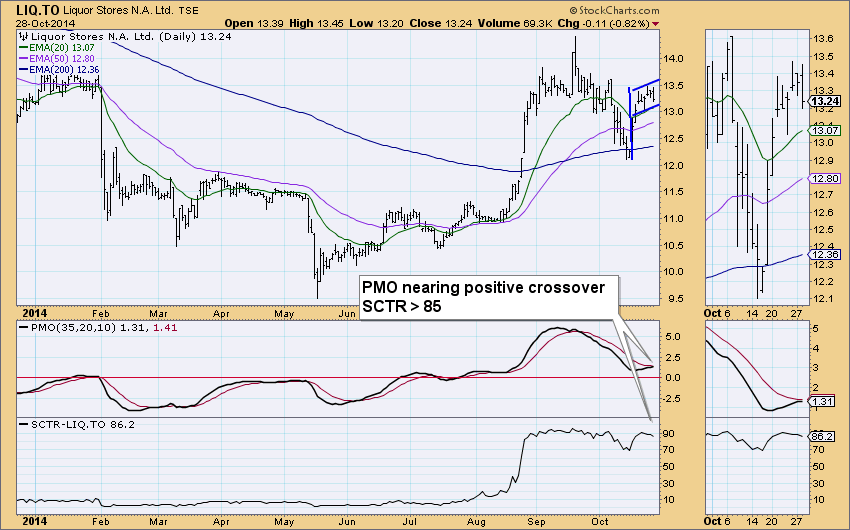
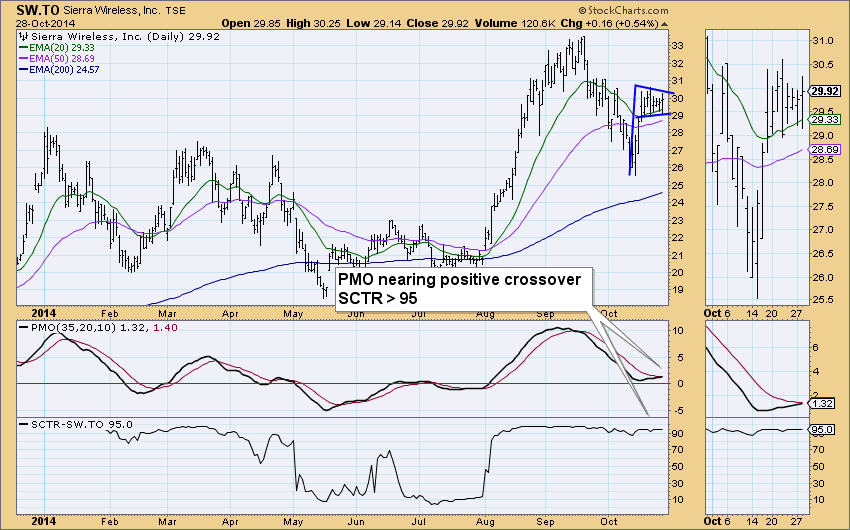
The Price Momentum Oscillator (PMO) is the DecisionPoint indicator that measures momentum and happens to be my favorite indicator (surprise surprise!). When I run my scan, I am looking for a PMO that is rising out of oversold territory with a bullish chart pattern. Below you'll see exactly that. I like to add the SCTR value to the charts because it measures internal and relative strength. So when you find a chart with rising momentum, a positive chart pattern and good internal/relative strength, it is worth noting. That's exactly what I've done for you.
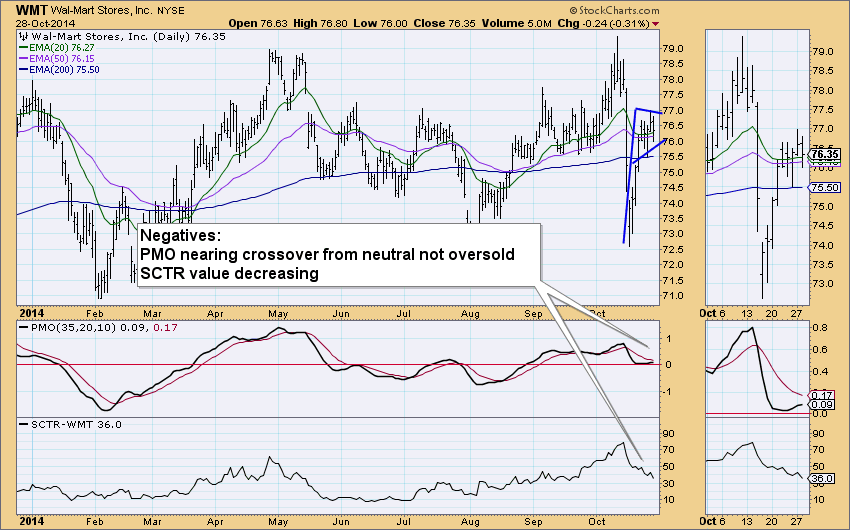
I've added Walmart below, but there are some detractors. So although there is a bull flag on the chart, the SCTR value has been falling and is only 36. Another concern is the PMO is bottoming in neutral territory, not oversold.
The scan that I used to gather these charts (and others not listed) is:
[type = stock] AND [Daily SMA(20,Daily Volume) > 50000]
AND[today's PMO Line(35,20,10)<today's PMO Signal(35,20,10)]
AND [today's PMO Line(35,20,10) > yesterday's PMO Line(35,20,10)]
AND [yesterday's PMO Line(35,20,10) > 2 days ago PMO Line(35,20,10)]
AND [2 days ago PMO Line(35,20,10) > 3 days ago PMO Line(35,20,10)]
AND [today's ema(20,close) > today's ema(50,close)]
AND [today's ema(50,close) > today's ema(200,close)]
Happy Charting!
Erin