Market Recap for Monday, September 28, 2015
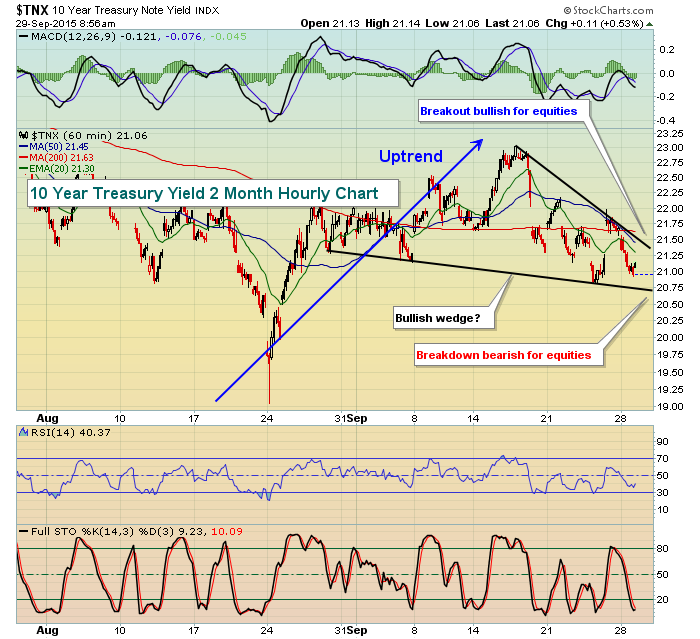
It was another case of the Monday blues. Following the lead in Europe, the U.S. indices gapped lower and continued selling throughout the session with barely a pause. It was a distribution day for sure and small caps (Russell 2000) were among the hardest hit. Every sector was lower with utilities performing best on a relative basis, dropping just 0.49%. Utilities were helped in large part by a falling treasury yield. The 10 year treasury yield ($TNX) closed below 2.10% for the first time in September and could be poised for another test of the August low close at 2.00%. That increased buying of treasuries, should it occur, would likely have a very negative impact on U.S. equities. The direction of the TNX should be monitored closely. In fact, with U.S. equities set to open strong this morning, we want to see the TNX rise to support this rise in equities. If the TNX turns lower later in the session, it would suggest more dark clouds rolling in for equities. Here's an intraday chart on the TNX and a few things to watch for:
Materials, healthcare and energy continued to be the relative laggards with each sector falling more than 3% on Monday. Our aggressive sectors - technology, industrials, financials and consumer discretionary - all performed in the middle of the pack. The XLY vs. XLP ratio (consumer discretionary vs. consumer staples) is not far from closing at a six month low. Watch that 1.54 level. A break beneath would add to the bearishness in equities. On StockCharts.com, the symbol to use is "XLY:XLP".
Pre-Market Action
At last check, the London FTSE, French CAC and German DAX were all near the flat line. Perhaps that's breathing a bit of relief into the U.S. market after a brutal Monday. U.S. futures show that traders are preparing for a rebound - at least at the start of the trading session. There's been a TON of pain and technical damage inflicted on the bulls and this period of weakness already looks to be much worse than what we saw back in October. A "V" bottom formed then with little resistance provided at the falling 20 day EMA. That has not been the case here in August and September. On that one rare occasion where we did temporarily negotiate that key short-term moving average, price resistance held - and it held in a big way on FOMC announcement day. Since that day, September 17th, the S&P 500 has fallen 140 points, or roughly 7%. The Russell 2000 has dropped 8.6%. We're into our second round of selling, something we didn't see in October 2014. As a result, we have to view this short-term weakness as potentially more than that until the bulls can prove otherwise. For that reason, I remain extremely cautious near-term.
In corporate news this morning, both Micron (MU) and Republic Airways (RJET) received upgrades from analysts. In the case of the latter, this upgrade precedes a period of historical strength for the airline industry. October has been a very strong performance month for airline stocks as can be seen below:
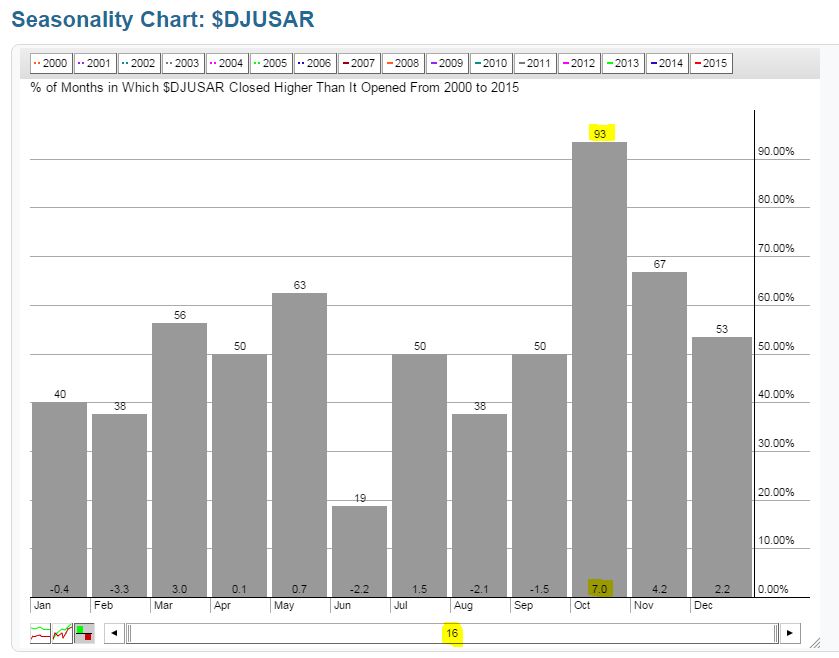
The historical strength seems to continue throughout the balance of the fourth quarter so airline stocks would be a group that I'd be looking to for positive technical developments to support these historical tailwinds.
Current Outlook
The action on Monday is simply driving home the point that we must be very cautious in this market environment. As discussed yesterday, the Volatility Index ($VIX) cleared that 24-25 resistance zone at the opening bell and the bears never let go of their market grip. The VIX ended up soaring 17% on the session to close at 27.63, its highest close since September 4th. High volatility generally leads to lower prices, but more importantly it sets up wild intraday swings. Many traders like all the excitement and "potential" gains. I hate it. My trading strategy is all about managing risk and risk is off the charts once again. This isn't low risk or controlled risk trading, it's more like rolling the dice at the craps table. No thank you.
Because of the increased volatility and the wide trading ranges now established on the daily charts, I'll delve into the intraday charts and provide a few key areas of support and resistance that I'd be looking at if I were to short-term trade this craziness. Let's look at the S&P 500:
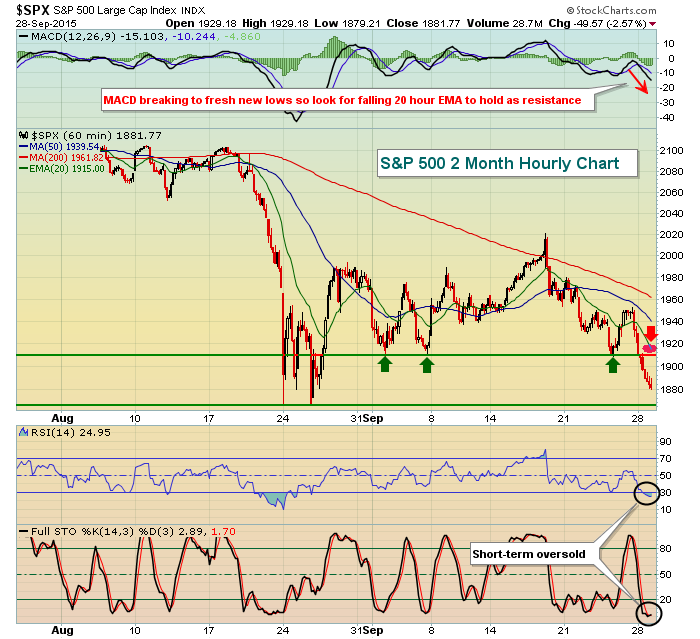
From the hourly RSI and stochastic readings, you can see we're short-term oversold. Readings below 30 on RSI represent oversold conditions and readings below 20 (especially 10) suggest the same for the stochastic. So we're oversold on this intraday chart as we approach those significant intraday lows from late August - 1867.61 was the low close on August 25th. That doesn't mean those lows will hold, but that's an area I'd look to for key support. Due to the accelerating downside momentum, as evidenced by a fresh new low (since the centerline reset) on the MACD, I would expect the falling 20 hour EMA to hold as resistance, along with the failed support from 1910. Previous September selloffs had stalled near 1910. Yesterday's selling cleared that support level and one of the basic premises of technical analysis is that broken support becomes resistance. Therefore, look to 1910-1915 as short-term resistance on a bounce attempt.
Sector/Industry Watch
Historically, the worst time of the year to invest in U.S. equities is from the July 17th close to the September 27th close. That's roughly a two and one half month period. To illustrate how rough this period has been in 2015, let's take a look at the past three months performance of all the industry groups in technology:
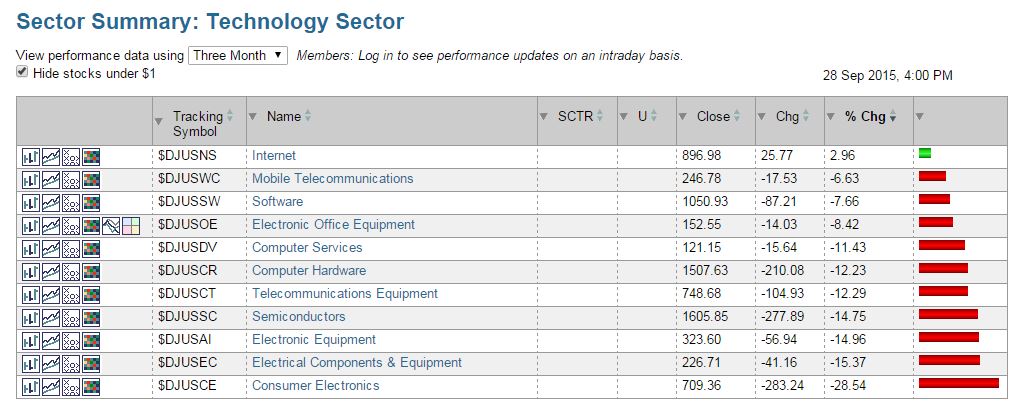
That should raise a few eyebrows. It's been horrible. Only the internet space ($DJUSNS) has managed to eke out a gain. Consumer electronics ($DJUSCE), on the other hand, has been DRUBBED, losing 28.54% in just three months. Outside of a quick bounce, it doesn't appear as though it'll get any better in this area in the near-term. Here's a one year chart showing that Monday's close eclipsed the double bottom formed with October 2014 and August 2015 lows:

Historical Tendencies
Here are the annualized returns for the S&P 500, NASDAQ and Russell 2000 for September 29th and 30th:
S&P 500 (since 1950): -85.86% (29th); -34.50% (30th)
NASDAQ (since 1971): -88.43%; -22.95%
Russell 2000 (since 1988): -0.16%; +41.40%
The differences above are only exacerbated as we move into the first week of October. More on that later in the week. The last few days of all calendar months tend to be quite strong historically as stocks begin to ramp up before money flows arrive to start a new calendar month. I consider it a legalized form of frontrunning as market makers, fund managers and hedge funds get in ahead of the crowd. But the end of September has been different and tends to carry on the bearish tendencies from earlier in the month.
But please keep in mind that historical tendencies are based exclusively on prior price history. They do not guarantee us anything about the future. I simply use the information as another tool to help me manage risk.
Key Earnings Reports
COST: $1.66 (estimate) - reports after the bell
Key Economic Reports
July Case-Shiller 20 city home price index to be released at 9:00am EST: +0.1% (estimate)
September consumer confidence to be released at 10:00am EST: 96.0 (estimate)
Happy trading!
Tom


