Market Recap for Thursday, December 31, 2015
Happy New Year! The action on Thursday to close out the year symbolized trading throughout all of 2015. We were down early, rallied to try to move into positive territory and then fell again in the second half of the session to finish with lower prices. Sound familiar? It should. 2015 was the year of consolidation.
There wasn't much to take from Thursday's action. The selling intensified as we closed out the year but we remain in a sideways consolidation pattern and the losses Thursday did nothing to change the pattern. Eight of our nine sectors finished lower with the oversold energy (XLE) sector the only one to post gains. Technology (XLK) was the big loser with all of its industry components falling on the session. Light volume took away some of the significance, but typically we see very bullish price action to close out calendar years. That was certainly not the case on Thursday.
I'll be hosting my first "Trading Places LIVE! with Tom Bowley" webinar of 2016 today at noon EST. I plan to discuss the technical picture as we open 2016 so I hope you can join me. CLICK HERE to register, it's FREE!
Pre-Market Action
China is the primary culprit for very weak U.S. futures as we kick off a brand new year in the stock market. Escalating tensions in the Middle East are not helping either. Asian markets tumbled overnight, led by the China Shanghai index ($SSEC), which was down 6.9% despite closing early due to circuit breaker limits. The S&P 500 has shown little in the way of positive correlation to the SSEC over the years, but it does tend to follow action in Germany. Unfortunately, the reaction in Europe, and particularly on the German DAX, has not been good either. Global markets are extremely weak and the U.S. is simply following suit in early pre-market action.
Current Outlook
Since the 2011 correction, stocks had moved higher in unabated fashion. In the event you didn't follow stock market action, here's a S&P 500 recap starting with the 2011 correction and ending December 31, 2014:
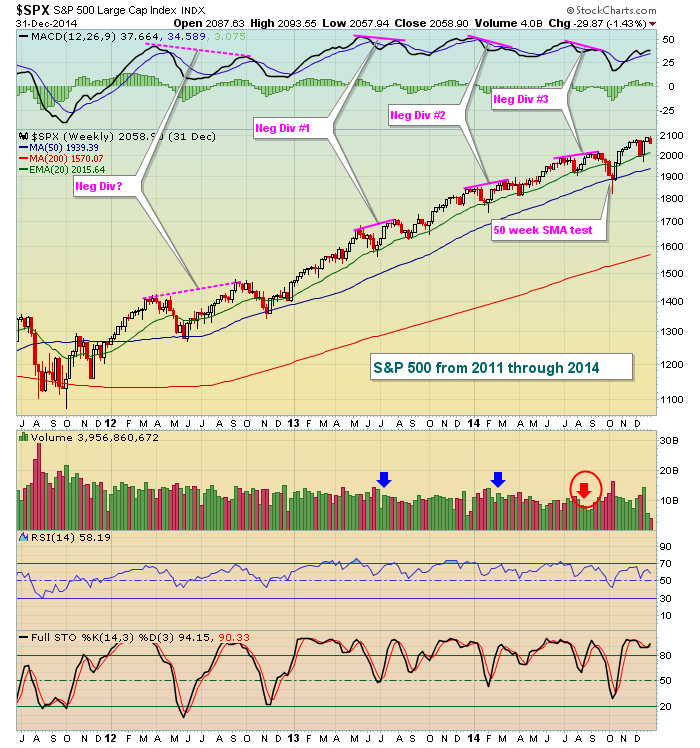
That's how it looked as we entered 2015. Note the various "negative divergences" along the way. The first occurred in 2012, although the selling between the two price peaks nearly took the MACD back down to the zero line. In my opinion, that's a MACD reset. Any time you get a MACD at or near its zero line, there is no momentum when you compare the 12 period EMA to the 26 period EMA (the MACD is the difference between the two). When that zero line, or centerline, test occurs, I consider it a "reset" and the search for momentum clues begins anew. Therefore, that second high (connected with the pink dotted line) in 2012 forms a negative divergence that doesn't bother me. The "Neg Div #1" shows higher prices with a 20 week EMA test in between the highs. That's much more meaningful to me because it does give me a better sense of slowing momentum. But keep in mind the MACD only considers price action, not volume. At the bottom of the chart, you'll see that volume was above 10 billion shares weekly as price broke out with apparent slowing momentum. "Neg Div #2" formed in much the same manner. Neither worked. To many, it's proof that technical analysis doesn't work. To me, it's not looking deep enough and not using good common sense. If momentum is truly slowing, shouldn't fewer traders be buying? Shouldn't volume drop? So while price action suggested slowing momentum, volume did not in cases #1 and #2. However, check out that "Neg Div #3". Not only does the MACD suggest price momentum is slowing, but volume confirms it. In that case, we saw the S&P 500's first true selling in two years or more.
Focusing solely on the combination of price/volume (I look at many other factors to assess market conditions, particularly intermarket relationships courtesy of John Murphy's earlier work), the S&P 500 looked to be in solid shape as we entered 2015.
So where do we stand as we enter 2016?
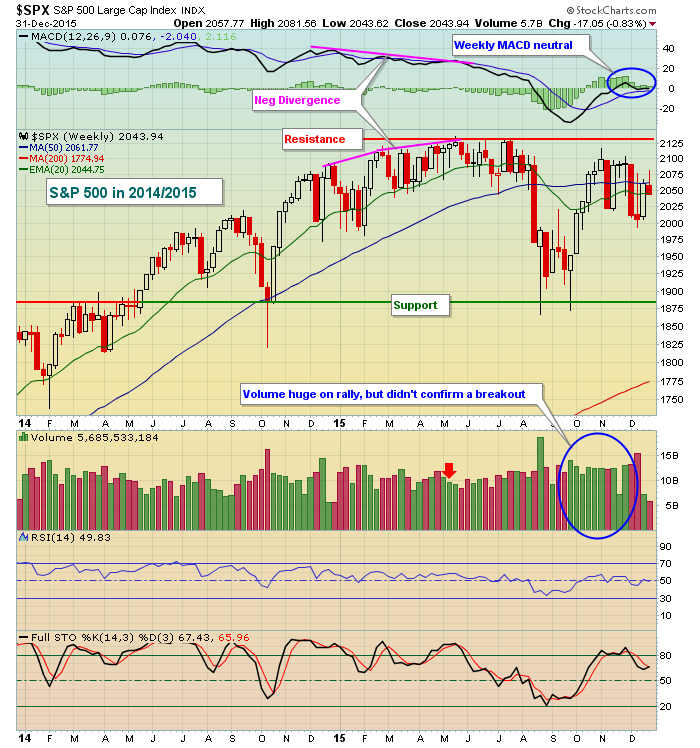
I could talk about this chart for an hour. There are multiple mixed signals. First, as prices continued rising into May 2015, note the MACD kept rolling over - a signal of slowing momentum. Volume wasn't bad, however, until that last high in May. Check out the volume under the red arrow. This is volume confirmation of the slowing price momentum. And we haven't cleared 2131 on the S&P 500 since. THAT IS JOB #1. I will not say the market is BULLISH until we clear that level and volume confirms it. The good news is that the MACD is reset so a fresh new price high will no longer signal slowing price momentum in my view.
The second point here is that the trading range has been established - price resistance is at that all-time closing high at 2131. Price support is clear at the October 2014 and August 2015 lows. The bad news is that trading ranges make short-term trading much more difficult. Your trading strategy MUST change. You should be willing to accept smaller gains and short-term moving averages become less reliable. A moving average moves higher during an uptrend and lower during a downtrend. Hopefully that makes sense. In a sideways market, however, moving averages frequently are ignored by price action. Momentum oscillators like the RSI and stochastic become better guides for traders. RSI 70 and stochastic 90 readings represent overbought territory. Be prepared to lock in profits there (if you're trading on the long side). RSI 30 and stochastic 10 readings represent oversold territory and that's where buying (or short covering) should be considered - at least until the market tells us which way this consolidation will break.
One big negative on this latest weekly chart is that the negative divergence was followed by a break beneath 50 week SMA support. That never occurred from 2011 to 2014. We simply saw the MACD reset and then the rally resumed. That changed in 2015. So if prices roll over during 2016 and price support is broken and lost, be prepared to consider bear market trading strategies. Bear markets occur with weekly MACD readings below its centerline. You can see above that we broke below that centerline area in August and the recent recovery simply took us back to centerline resistance. Another drop from here would begin to look more bearish.
Finally, the volume on the last rally looks very solid. But for me, it's the combination of price/volume that matters. Yes, the volume on the push higher is good news. But we didn't clear key price resistance so there's no confirmation of a bullish technical pattern (bull flag).
Please be aware that money rotated heavily toward more defensive areas of the market in the second half of 2015, especially so in December. That is a bearish development no doubt. My biggest fear in shorting stocks is the fact that central bankers around the globe remain fixated on quantitative easing (QE) and announcements spur global markets on a moment's notice. That's one of the biggest risks, if not the biggest, in remaining exclusively on the short side.
Sector/Industry Watch
Banks ($DJUSBK) are always important to keep an eye on in helping to determine future stock market direction. Why? Because they are responsible for providing the credit necessary to keep our economy humming along. When they break down technically, it's a sign that their profits are likely to erode in the weeks and months ahead. By and large, banks are a very conservative bunch, despite what you hear on CNBC about big banks taking huge risks. When they see trouble brewing, they tend to hunker down and tighten their purse strings. That leads to much tighter credit and difficulty for the overall economy to expand. I ALWAYS watch the performance of banks, even if I have no desire the trade the group. Here's how the DJUSBK looks as we enter a fresh new year:
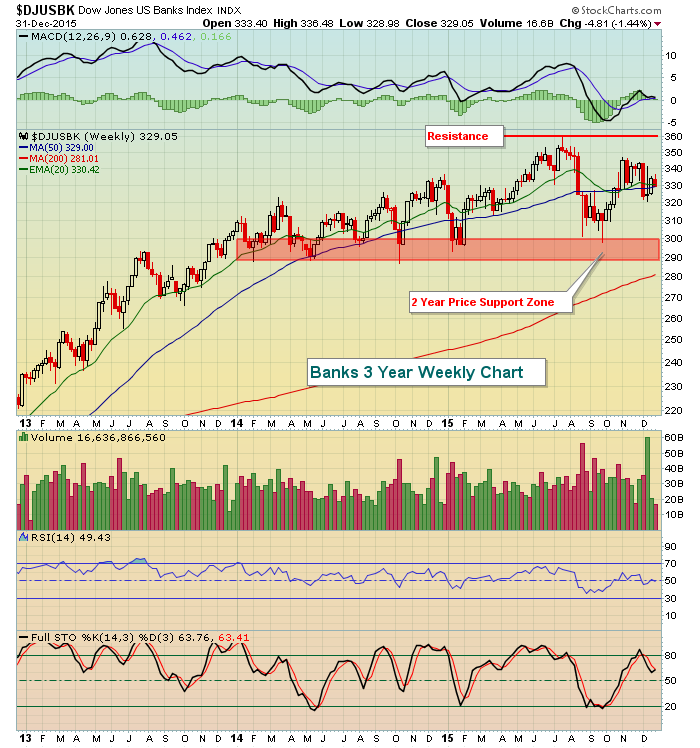
We haven't seen a breakdown, but support has been firmly established in the 290-300 area. Also, that weekly MACD is a bit suspicious, hanging near its centerline. Right now, it appears that banks are preparing to trade in this consolidation range in 2016.
Historical Tendencies
The weak action overnight and apparent weak open here in the U.S. is a concern based on history. There's quite a strong correlation between stock market performance in January and stock market performance throughout the balance of the year. I'll be providing some details here during the month so be sure to keep checking in here. Early January typically is strong, but as we saw in December history provides us no guarantees, just tendencies.
Key Earnings Reports
None
Key Economic Reports
December ISM manufacturing index to be released at 10:00am EST: +49.2% (estimate)
November construction spending to be released at 10:00am EST: +0.7% (estimate)
Happy trading!
Tom
