Market Recap for Thursday, June 29, 2017
That's exactly what it's felt like recently. Financials (XLF) have easily been the best performing sector over the past week, rising nearly 3%, while energy (XLE) is the only other sector in positive territory as crude oil ($WTIC) has spiked from $42 per barrel price support to test (and fail at) its declining 20 day EMA just above $45 per barrel. Here's a look at both crude and the XLE:
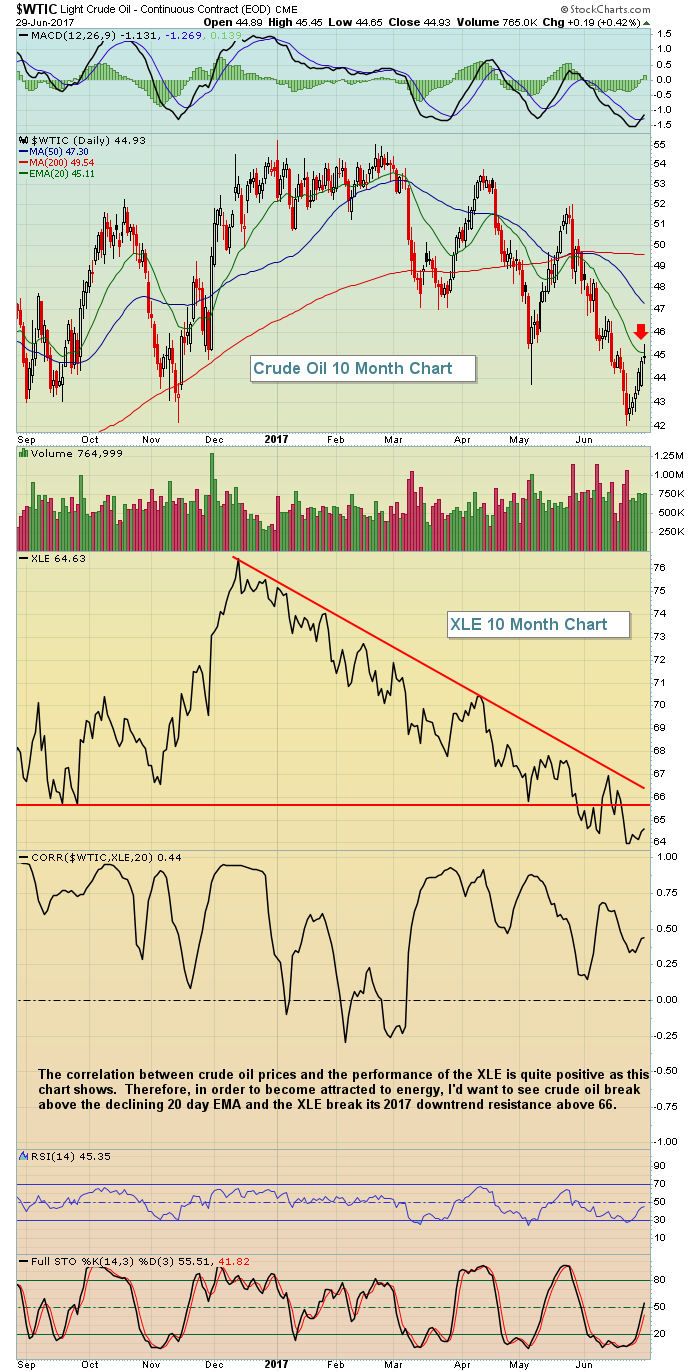 The red arrow shows yesterday's failure at the falling 20 day EMA. Crude oil traded above that moving average intraday, but failed to hold that level into the close. The other problem is that the XLE barely moved higher while crude oil has bounced. That's discouraging as well. So while energy has been a nice performer the past week, offsetting the much weaker technology area, the XLE hasn't moved like I would've expected with crude oil bouncing 6-7%.
Banks and life insurance, however, have reacted strongly in bullish fashion to the rise in treasury yields. Check this out:
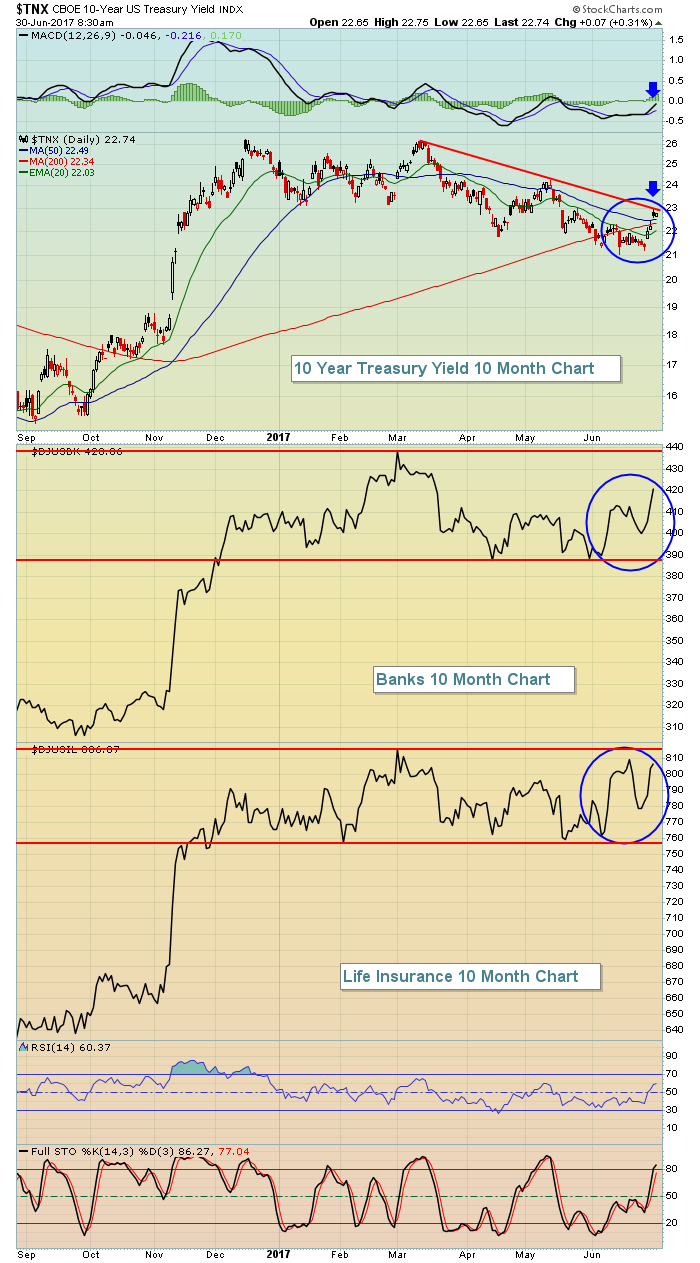 The blue circles highlight the strength of the DJUSBK and DJUSIL as the TNX has risen. The red trendline resistance on the TNX is huge. Breaking above that resistance should provide tailwinds for a much stronger upside move from both financial groups. The DJUSIL is on the cusp of another breakout as the TNX is now showing a near bullish MACD centerline crossover and trendline breakout (blue arrows).
There was plenty of selling on Thursday, however, as technology (XLK, -1.79%) once again led the list of selling. Semiconductors ($DJUSSC) and internet stocks ($DJUSNS) were the primary laggards, although all technology industry groups moved lower.
Pre-Market Action
Treasury yields and crude oil are both fractionally higher this morning so look for continued strength in both financials and energy - at least in early trading. Futures are mostly positive with Dow Jones futures looking to show strength at the opening bell as they're currently higher by 34 points.
Current Outlook
It seems the market is either firing on all cylinders....or enjoying very narrow strength - as it did yesterday with just energy and financials. As a result, the benchmark S&P 500 has felt little in the way of technical deterioration. There's always seemed to be strength somewhere to hold up this key index. Despite the strength in financials and energy yesterday, though, the S&P 500 did fail to hold onto key short-term price and gap support levels, while maintaining support at a more intermediate-term support level. Take a look:
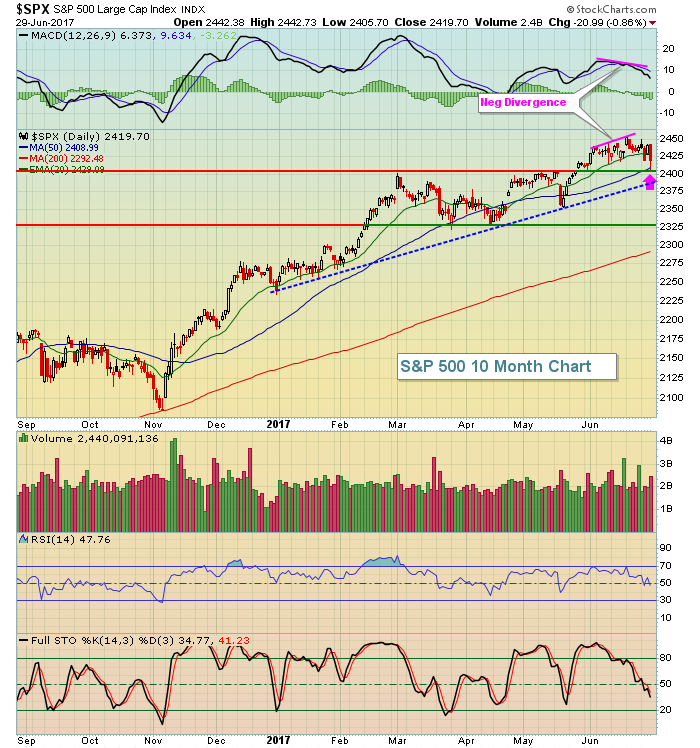 The S&P 500 had two momentum issues, but was able to resolve one of them yesterday. So here's the good news: The negative divergence above may very well be resolved with the 50 day SMA test (pink arrow). Now for the bad news. There's a weekly negative divergence that could take much more consolidation and selling in the weeks ahead. Let's stretch out the timeframe and check this out:
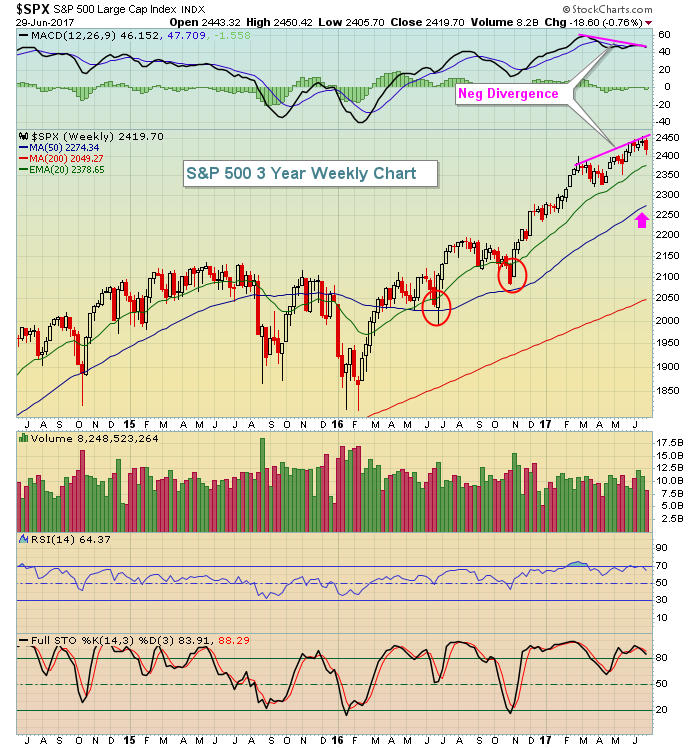 While the daily chart can be frightening at times because we see breakdowns more commonly beneath key moving averages, you can see that the above weekly chart smooths things out a bit. We've only seen two weekly closes beneath the rising 20 week EMA since early 2016. That's the definition of a very nice uptrend. The negative divergence here, however, suggests we could see a 50 week SMA test (pink arrow) in upcoming weeks - probably sometime during the summer months. This is not a guarantee as the S&P 500 was able to continue its uptrend back in 2013 with suspicious negative divergences in play. Instead, the way to view this development is that risks are increased. Be aware of them.
Sector/Industry Watch
Industrials (XLI) have provided leadership during much of the past year's rally, especially during the November and December rally. After consolidating for a bit, we've recently seen relative strength here again. We'll need to watch absolute price support areas as well as relative strength during the summer. Here's the current visual:
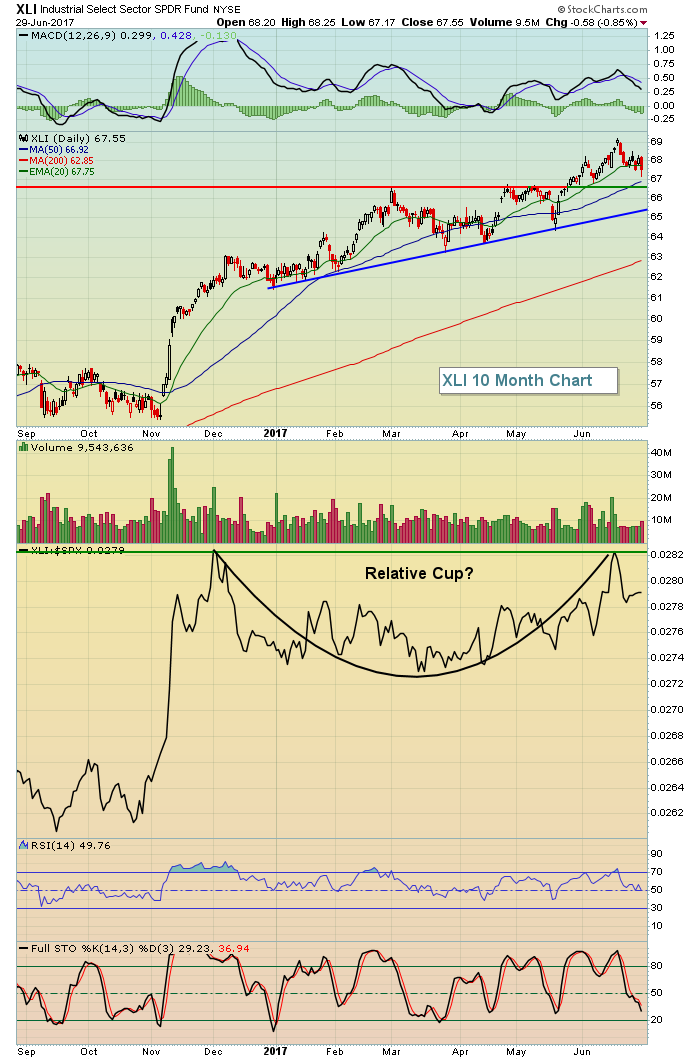 Given the above absolute and relative strength, look for solid support on the XLI between 65.50-66.50.
Historical Tendencies
There are four months that have 30 calendar days - April, June, September and November. During those months, the 30th represents the final trading day obviously. Since 1950 on the S&P 500, this day has produced annualized returns of just 3.94%. Typically we see strength the final day of a trading month, but for some reason the 30th of these four months does not follow that overall trend.
Key Earnings Reports
None
Key Economic Reports
May personal income released at 8:30am EST: +0.4% (actual) vs. +0.3% (estimate)
May personal spending released at 8:30am EST: +0.1% (actual) vs. +0.1% (estimate)
June Chicago PMI to be released at 9:45am EST: 58.2 (estimate)
June consumer sentiment to be released at 10:00am EST: 94.5 (estimate)
Happy trading!
Tom
