Market Recap for Wednesday, June 28, 2017
All of our major indices finished higher on Wednesday with the small cap Russell 2000 and tech-laden NASDAQ indices leading the charge with 1.55% and 1.43% gains, respectively. We saw solid participation across the board, however, with the Dow Jones ending the session just 75 points from an all-time high close.
Eight of nine sectors rose on Wednesday, underscoring the wide participation and strength of the advance. We're nearing the end of June and we know that history tells us the market tends to rise into month end and early in the following month due to the anticipation of money flows - and then actually seeing them. One of the biggest surprises over the past week, though, is the fact that the oversold energy sector has barely budged higher despite crude oil prices ($WTIC) rising during the past five trading sessions.
Financials (XLF, +1.57%) and technology (XLK, +1.25%) provided the biggest lift to our major stock indices as a suddenly rising 10 year treasury yield ($TNX) boosted the shares of life insurance ($DJUSIL) and banks ($DJUSBK). In technology, the recently weakening semiconductor group ($DJUSSC) bounced back 1.90% to easily lead technology's gains.
Pre-Market Action
Dow Jones futures are up slightly this morning, but NASDAQ futures are down 32 points as we're looking at a bifurcated U.S. market when the opening bell rings in 30 minutes.
Crude oil ($WTIC) has been on a tear of late, with a current winning streak of six sessions, including today's small gains in early trading. Last week, I had mentioned the potential of a short-term bounce off support at $42 per barrel to overhead, declining 20 day EMA resistance above $45 per barrel. Now that we've made that bounce, trading from this level will become much more interesting technically.
Current Outlook
It's been a very rough month for the NASDAQ, not necessarily in terms of overall returns, but rather the increased level of volatility. The good news is that the NASDAQ has been able to hold onto both price support and its rising 50 day SMA:
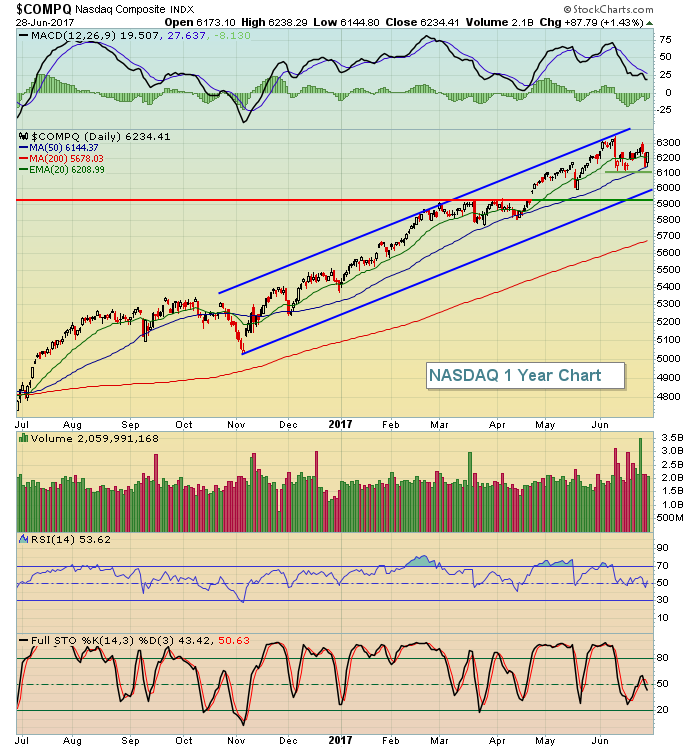 The key price support levels are as follows:
(1) recent June price lows near 6100.
(2) price support near 5925 (after consolidating there in March/April)
(3) a more subjective channel support near 6000 based on the slope of the recent price highs
Based on the above, I consider the 5925-6100 level to provide excellent short-term support. Should it be violated, then more summer doldrums could lie ahead, especially given the negative divergences present on the benchmark S&P 500's daily and weekly charts.
Sector/Industry Watch
The Dow Jones U.S. Transportation Services Index ($DJUSTS) rose nearly 3% on Wednesday and it's been performing extremely well over the past five weeks or so with each pullback finding support at the rising 20 day EMA. That's a sign of a trending index and a breakout above the 262.00-262.50 level would confirm the likelihood of further gains ahead. Check it out:
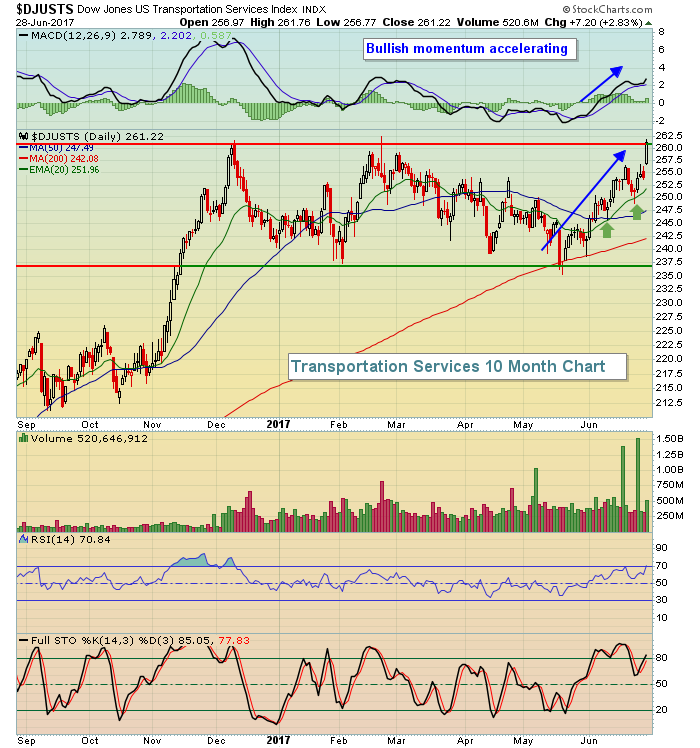 Bullish momentum is strengthening and looks poised for a breakout sooner rather than later.
Historical Tendencies
As we head into the month of July, it's worth noting that the best industry group (in terms of July historical performance) is the Dow Jones U.S. Diversified REITs ($DJUSDT) as is highlighted below:
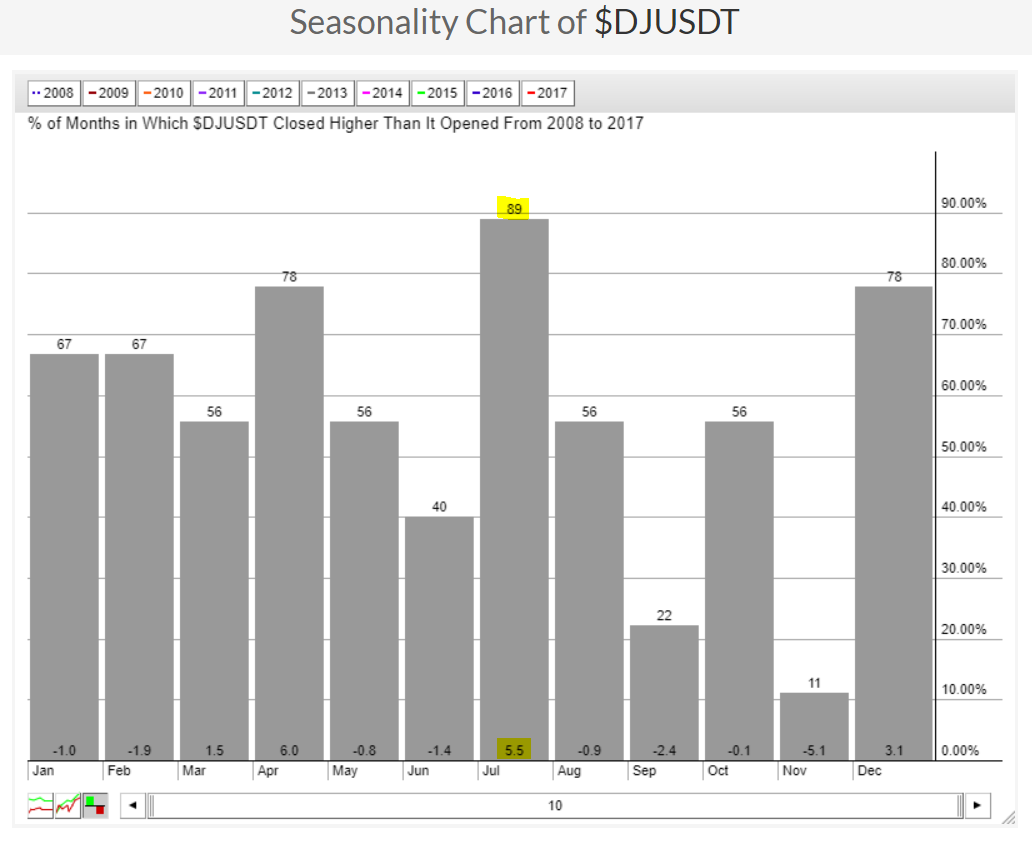 Many industry groups provide us 20 years worth of data, which is much more statistically relevant than the 10 years worth that is featured above on the DJUSDT. Still, July really stands out as a remarkable month for diversified REITs and should be taken into consideration when trading.
Key Earnings Reports
(actual vs. estimate):
CAG: .37 vs .38
MKC: .82 vs .77
STZ: 2.34 vs 1.98
WBA: 1.33 vs 1.31
(reports after close, estimate provided):
MU: 1.37
NKE: .49
Key Economic Reports
Final Q1 GDP released at 8:30am EST: +1.4% (actual) vs. +1.2% (estimate)
Initial jobless claims to be released at 8:30am EST: 244,000 (actual) vs. 241,000 (estimate)
Happy trading!
Tom
