Art's Charts January 27, 2023 at 12:03 PM
Last week I featured the S&P 500 SPDR (SPY) with a clear resistance level to beat. Even though the 2022 decline could be a correction after a big advance, the ETF is short of a breakout and trend reversal... Read More
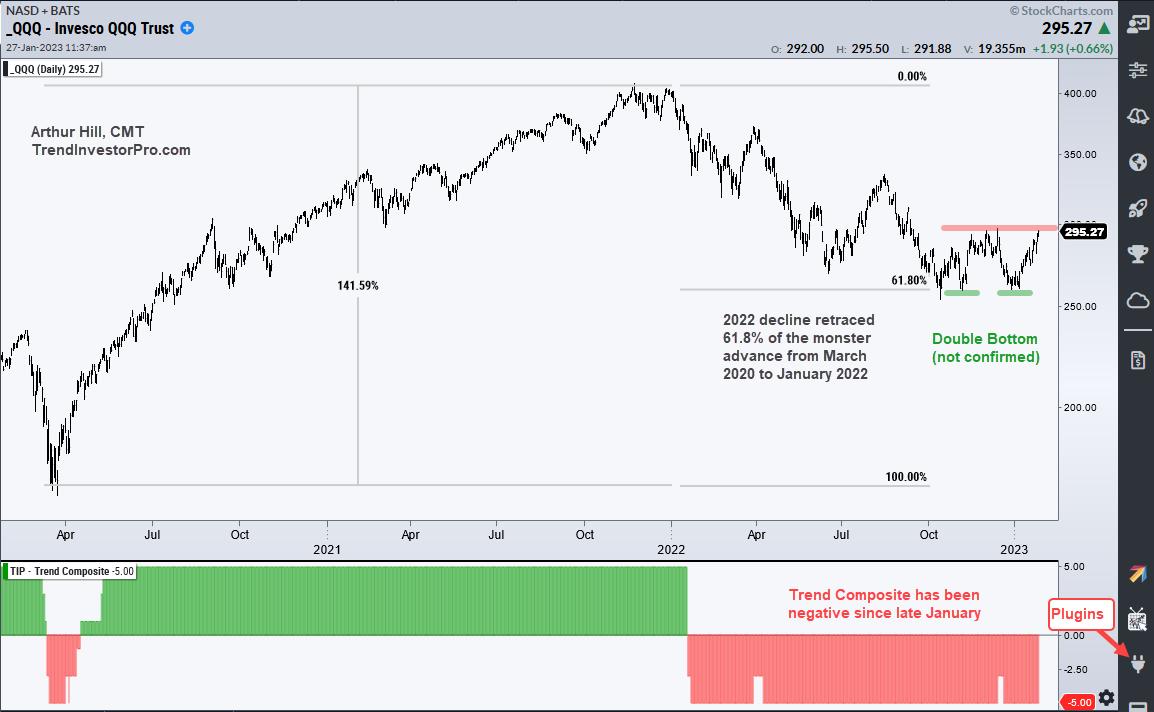
Art's Charts January 21, 2023 at 05:59 AM

The S&P 500 index has been trending lower since its peak in January 2022, but this decline could be a long correction after a massive advance. The pattern taking shape and the retracement amount is typical for corrections... Read More
Art's Charts January 16, 2023 at 02:48 AM

Trevor Lawrence put in a performance for the ages in the AFC Wild Card game on Saturday. Chapeaux! Lawrence started the game with four interceptions in the first half but kept on throwing and brought his team back for a big win... Read More
Art's Charts January 13, 2023 at 04:44 PM

The stock market has a long-term bullish bias and the monthly return metrics reflect this positive bias. Chartists looking for a seasonal edge can compare benchmark metrics with the monthly performance numbers... Read More